Jack B. Reid
jack@jackbreid.com
Github profile: jackreid Hosted on GitHub Pages — Theme by mattgraham
Miscellaneous Visualizations
Here is a collection of miscellaneous visualizations that were too niche or small to warrant a full project page. Some of these may be developed further, but for now they live here.
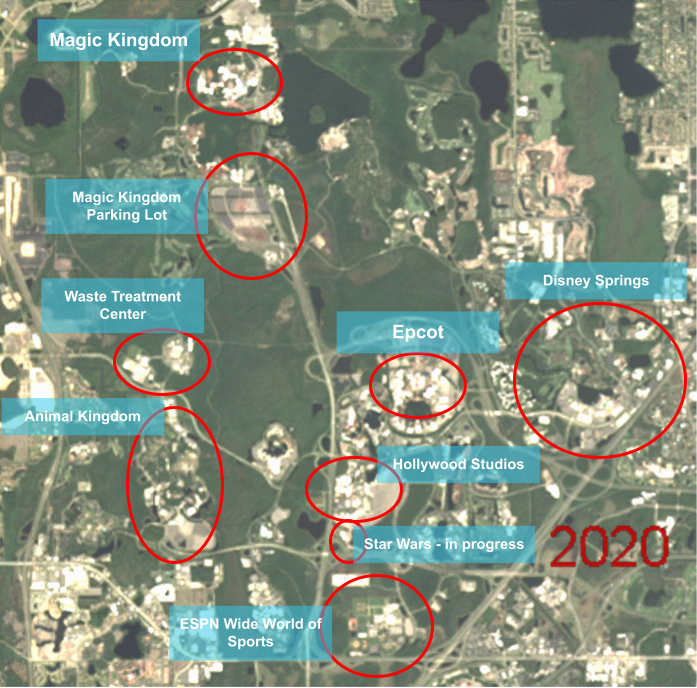
Disney World Timelapse
November 2021
A fun side project that I was asked to make today. This is Walt Disney World from 1972 (one year after it opened) to the present. Dark is water and built environment, bright is vegetation. Resolution improves in 1984. First time using Landsat 1-3!
Here’s the visual imagery (only going back to 1984)
And here’s a labeled image so you know what you are looking at. Plenty of other locations of interest of course (including the lakes!) but this was getting busy enough as is.
Countries With Operational Spacecraft
April 2021
Made a little visualization of which countries had operational spacecraft in each year, for an expansive definition of “had” (e.g. ESA’s spacecraft are attributed to all full member states). Almost certainly are mistakes, will revise. This was based on a combination of Gunter’s Space Page, N2YO, Wikipedia, and just googling about different countries’ space activities. If someone knows of a good comprehensive source by year, I am all ears.
Texas Winter Storm Blackouts
Feb 2021
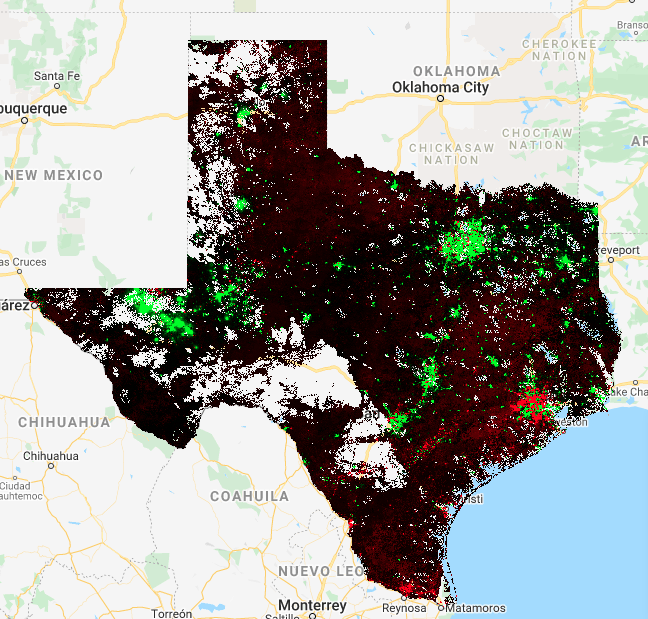
In February of 2021, Texas was hit by a severe winter storm that, in conjunction with various decisions made by the managers of the electric grid, resulted in widespread and sustsained blackouts. A ton of caveats here, but I thought that I’d try to see the Texas blackouts in satellite imagery. In these images I am comparing the two previous workweeks to Tues ~2am & Wed 3am (when VIIRS flew by). Red is darker, green is brighter, gaps are clouds/water
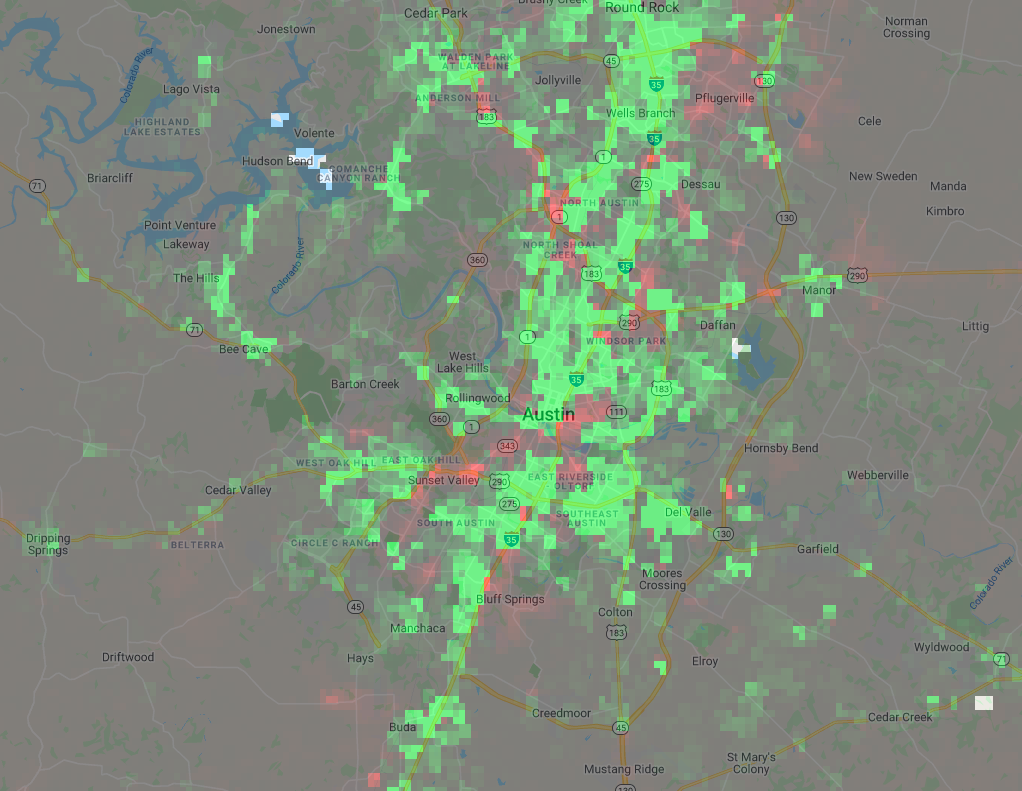
Here’s Austin. Assuming that these differences are actually the blackouts, they aren’t clustered on one side of town or anything, but are clumped.
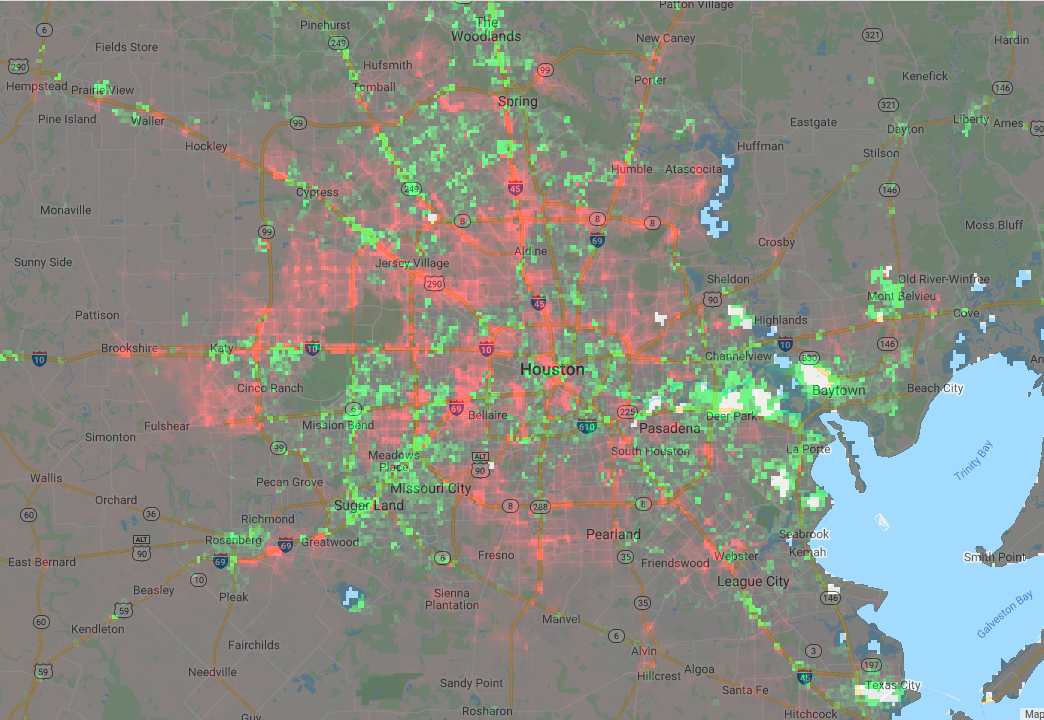
Here’s Houston, which seems to be much darker than Austin was. Notably, this data matches the analysis that NASA posted a week later, so evidently I knew what I was doing here for once.
And here’s DFW. Not sure what to make of this.
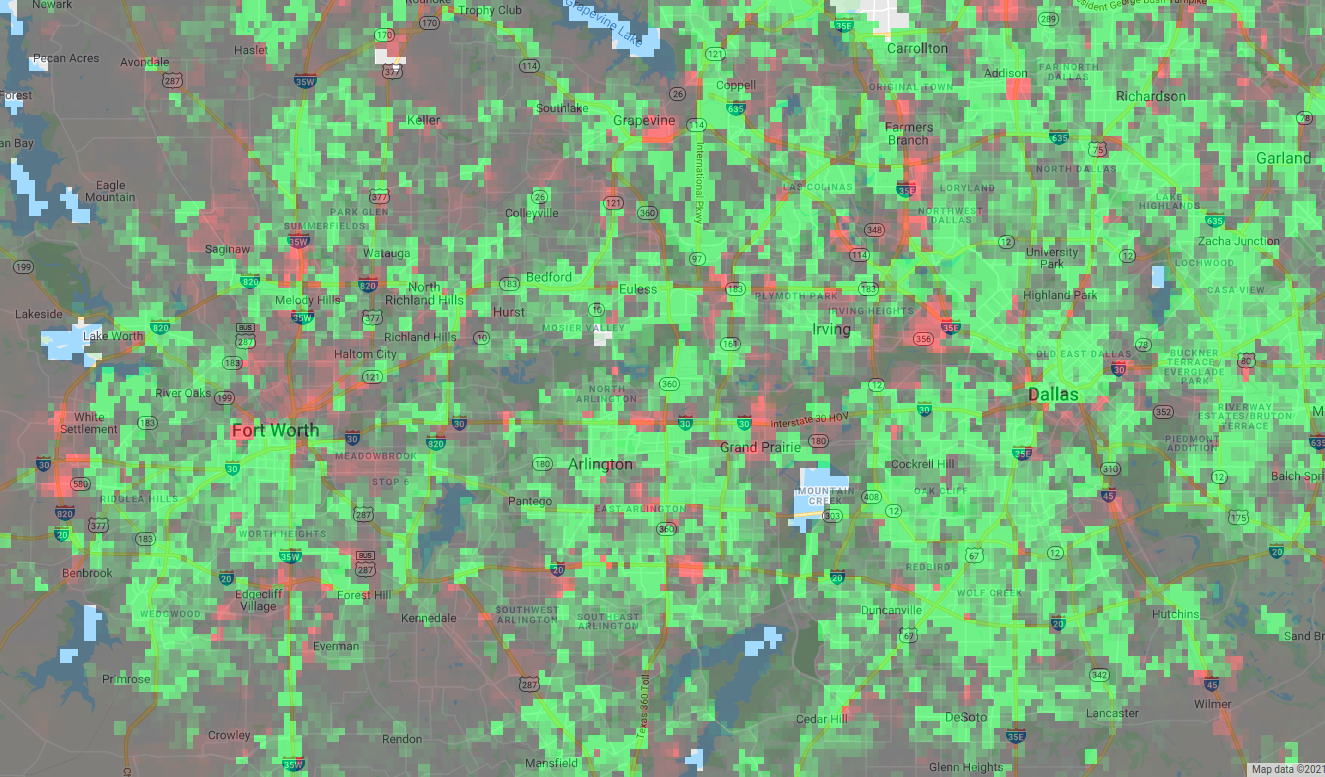
I’m curious how these match up with people’s experiences. Might be that two momentarily snapshots don’t capture the rolling nature of some of the blackouts.
And San Antonio isn’t here because they were completely covered by clouds on Tues/Wed mornings. Sorry, y’all! For those interested, this is using the VNP46A1 dataset, which isn’t perfect. I may redo this once VNP46A2 gets caught up with the present, which should happen in a couple of weeks. I may look around for another good Day/Night Band dataset too.
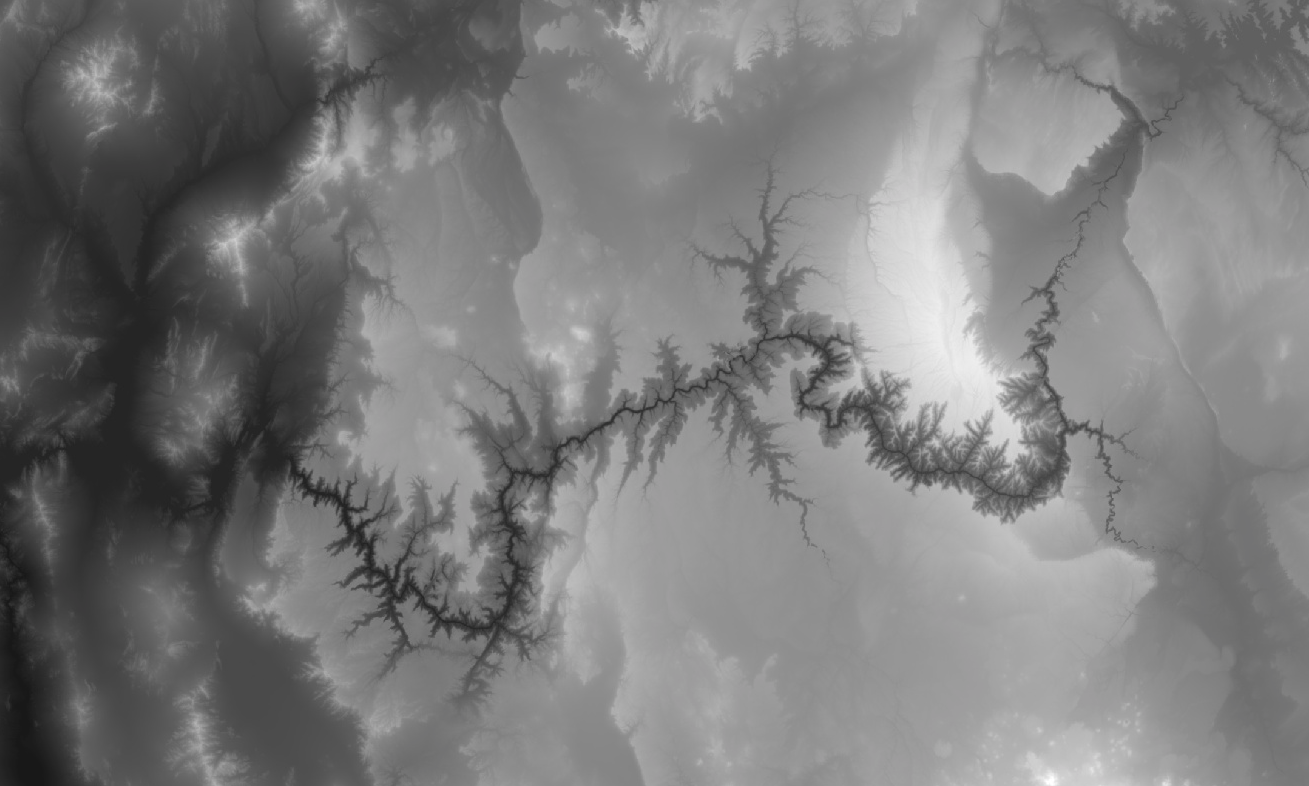
First Processed Satellite Image
Circa 2018
This was the first satellite image that I processed. It’s the Grand Canyon, but I honestly don’t remember what instrument or what bands I used. I’m not even sure when exactly I made it. I do remember that I used Google Earth Engine.