Jack B. Reid
jack@jackbreid.com
Github profile: jackreid Hosted on GitHub Pages — Theme by mattgraham
Earth Observation Art
Active March, 2021 to Present
When working with remote observation imagery in my professional capacity, I would often unintentionally generate images that are strange, beautiful, funny, or otherwise visually interesting. Some of these are intermediate products, some are the results of bugs in my code or errors in the underlying datasets, some are result of an odd selection of bands or color palette. Typically these images have little to no scientific or application value, so I would quickly press on and leave these images behind.
One day, however, I wondered what would happen if I intentionally set out to make such images for their own sake. So that’s what I set out to do in my free time: making some new piece of Earth Observation Art (almost) every week. It turns out that this endeavor resulted in a number of side benefits. It gave me opportunities to try out new datasets. It forced me to learn new analysis techniques in order to translate an idea into reality, It showed me just how wild and diverse our world is. But ultimately the reason why I keep doing it is that it keeps working with EO data fun.
I post these images on social media, namely Twitter and Instagram each week, so if you see hashtags and @ in the descriptions for these pieces, that’s what they refer to.
The primary platform I use for manipulating and generating these images is Google Earth Engine. You can access the scripts for each weekly project here (apologies for the lack of comments and overall terrible organization, but this ain’t exactly a professional endeavor). Note that some of the assets that I used my not have permissions set properly, so if you can’t get anything to run, just reach out via email or twitter. Some of the pieces also involve some python scripts run on my laptop. I haven’t organized these into any repository yet. If that’s important to you, reach out and I can move that up my list of priorities.
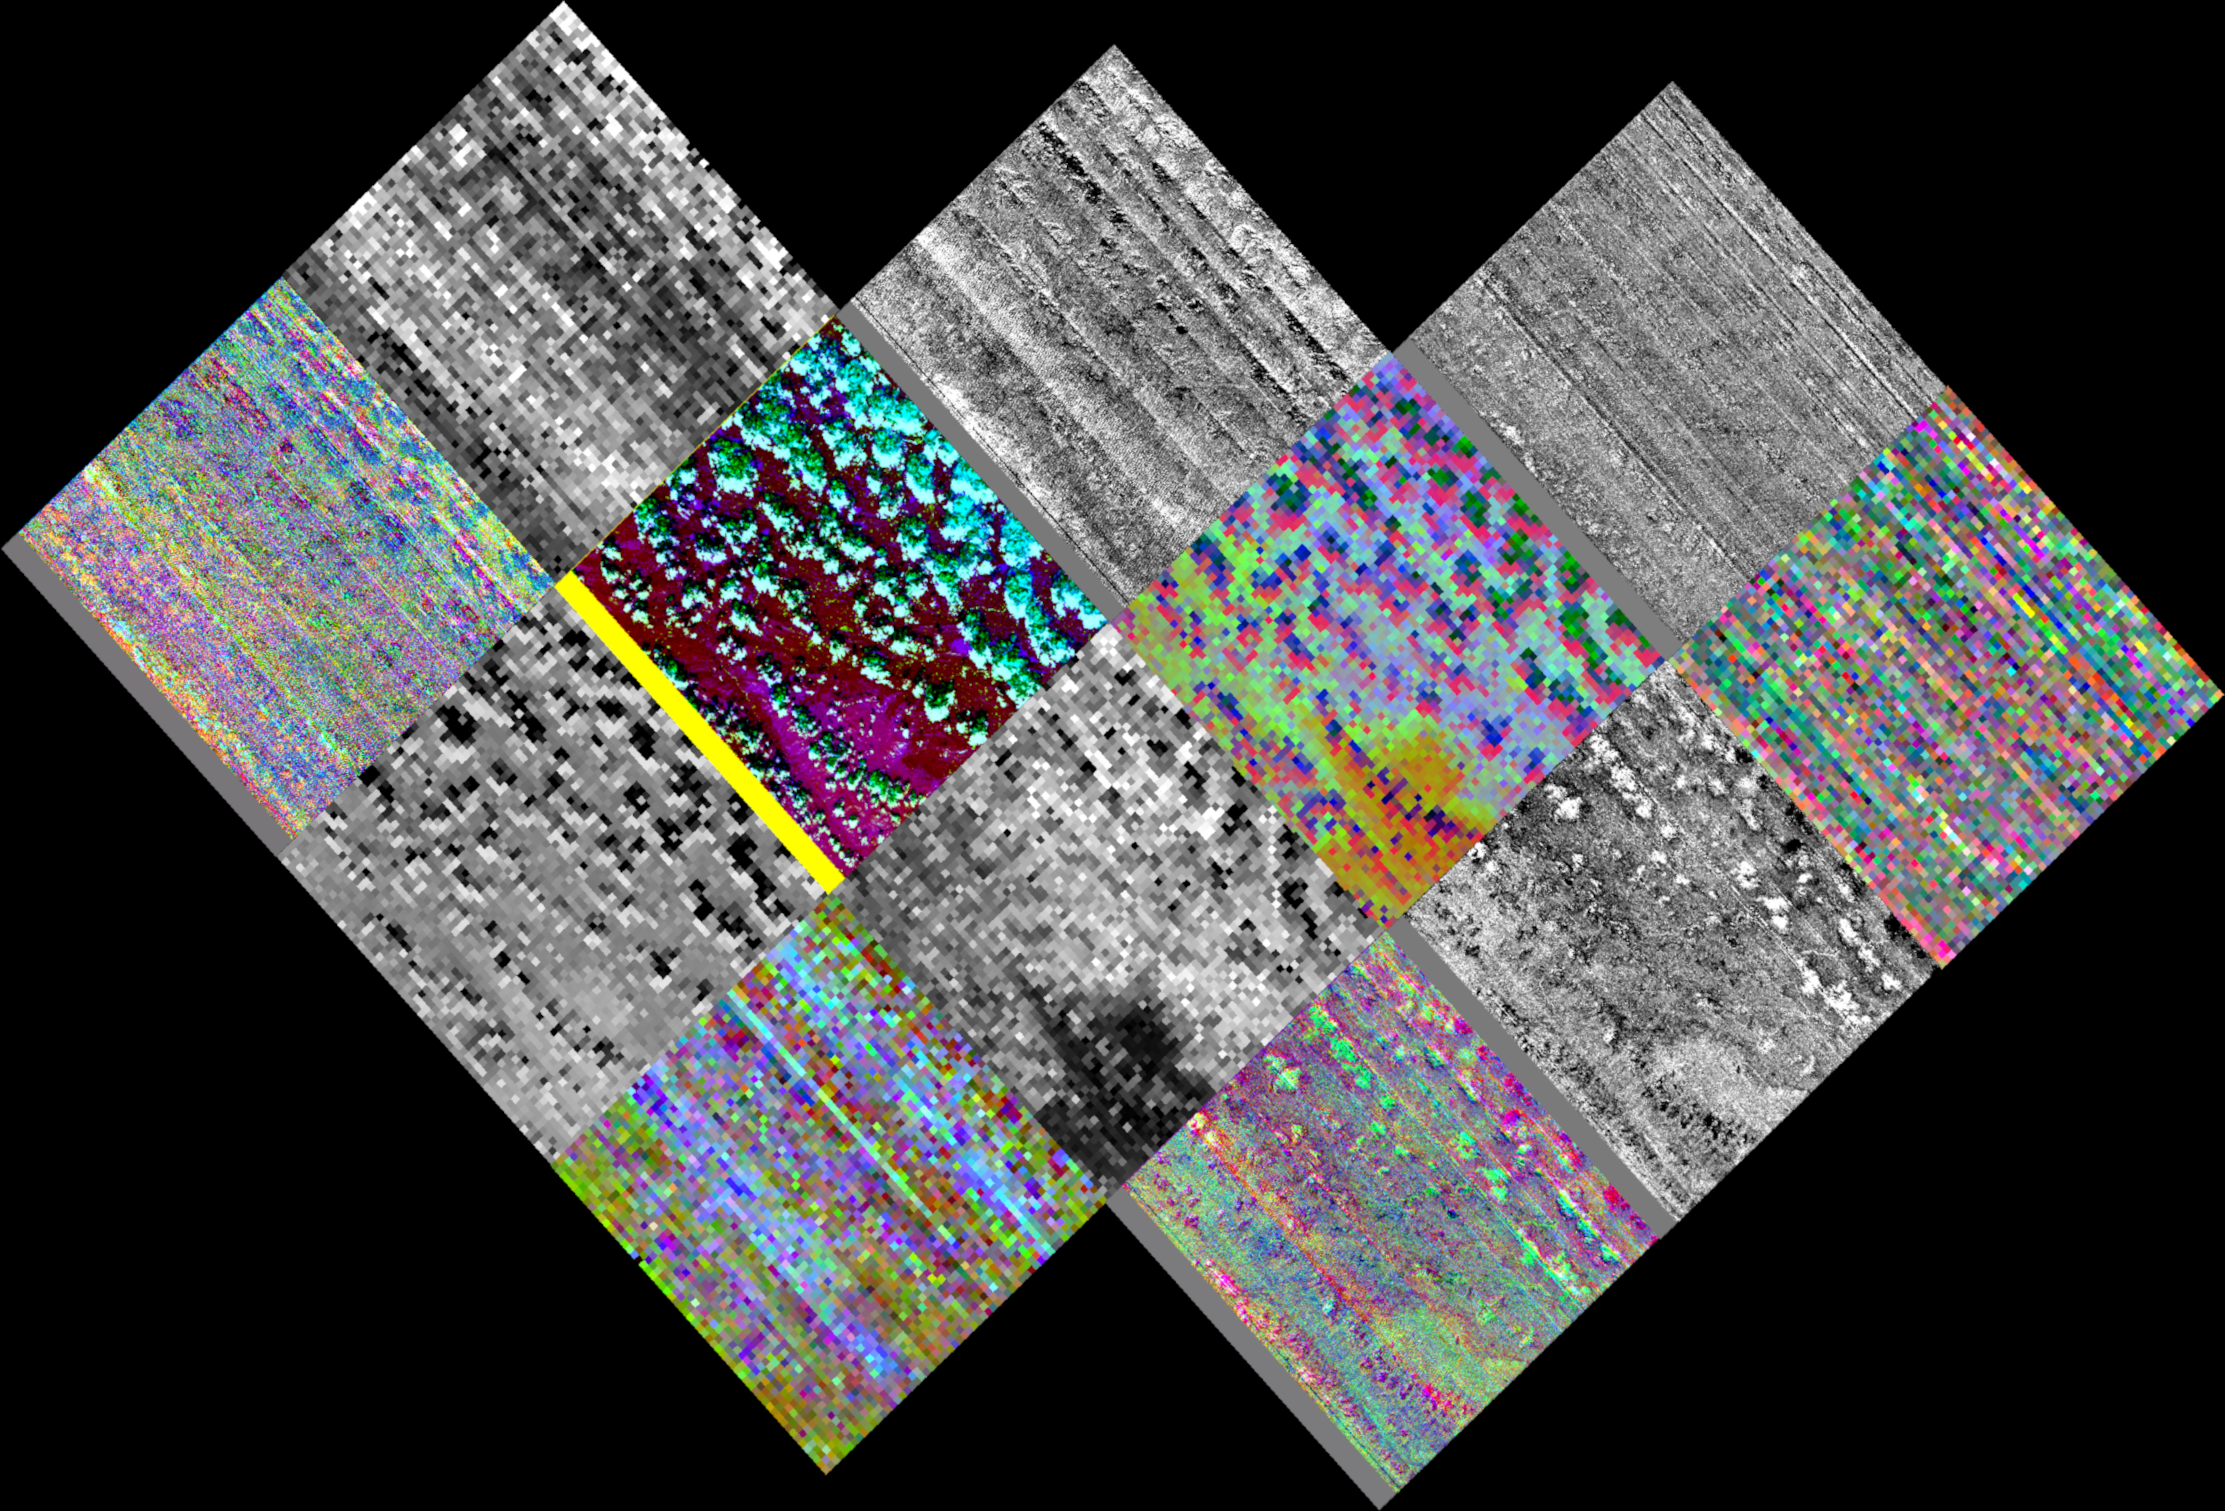
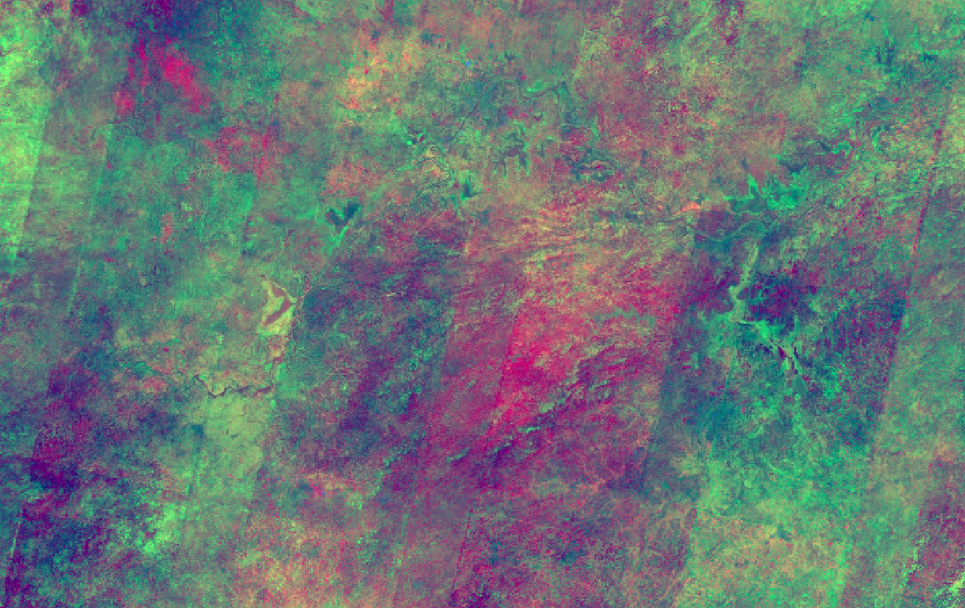
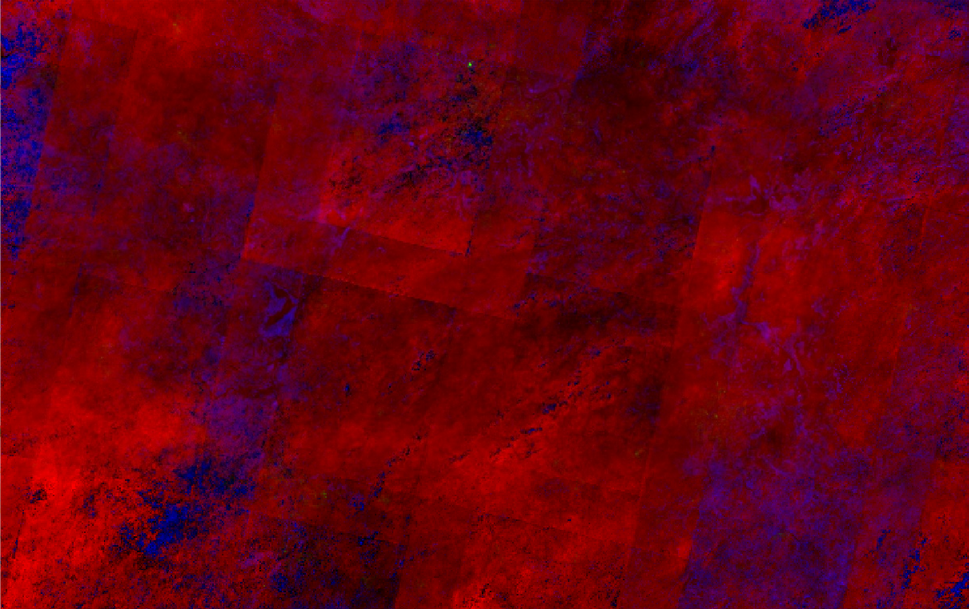
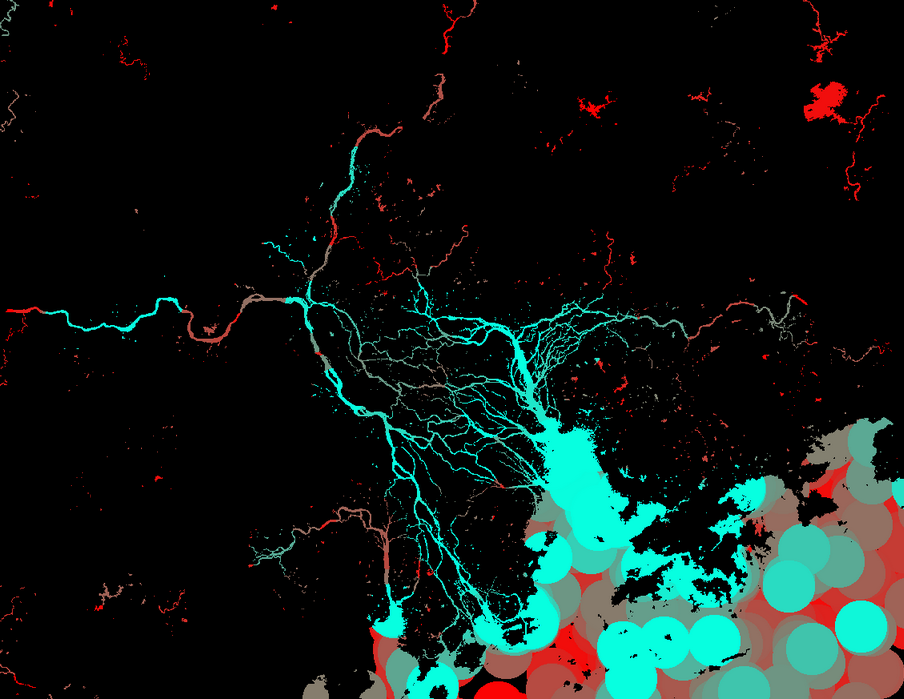
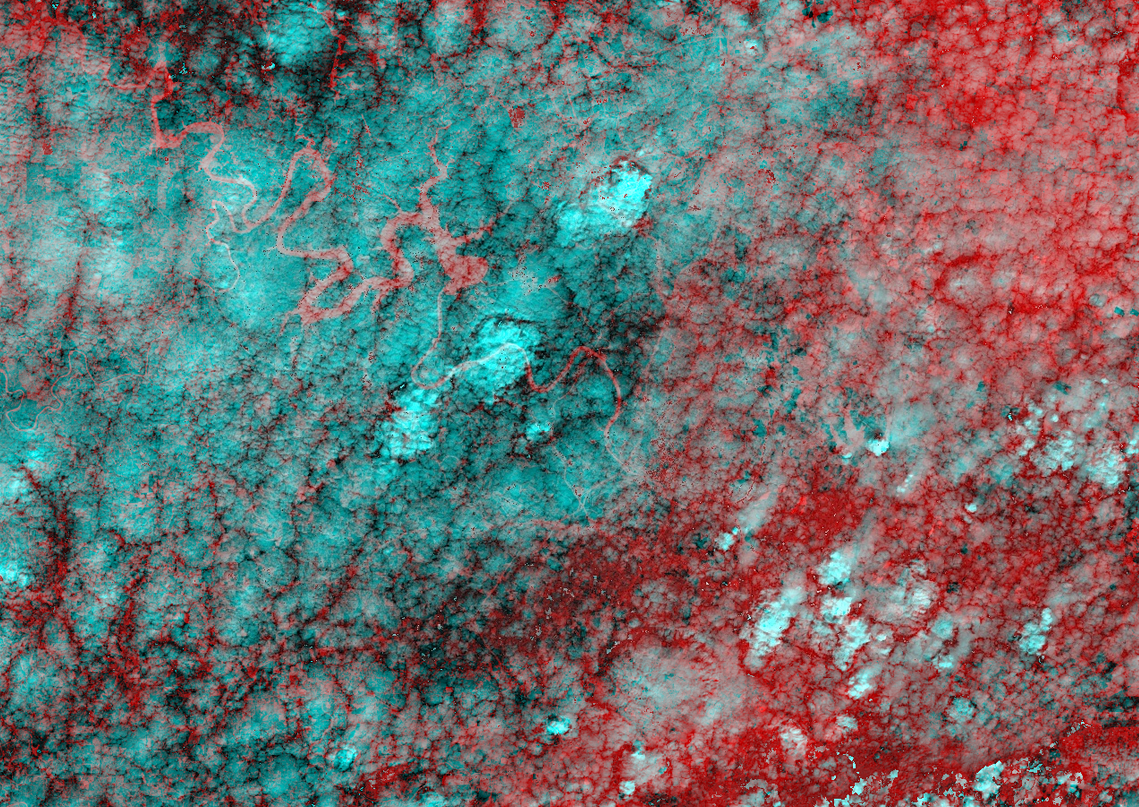
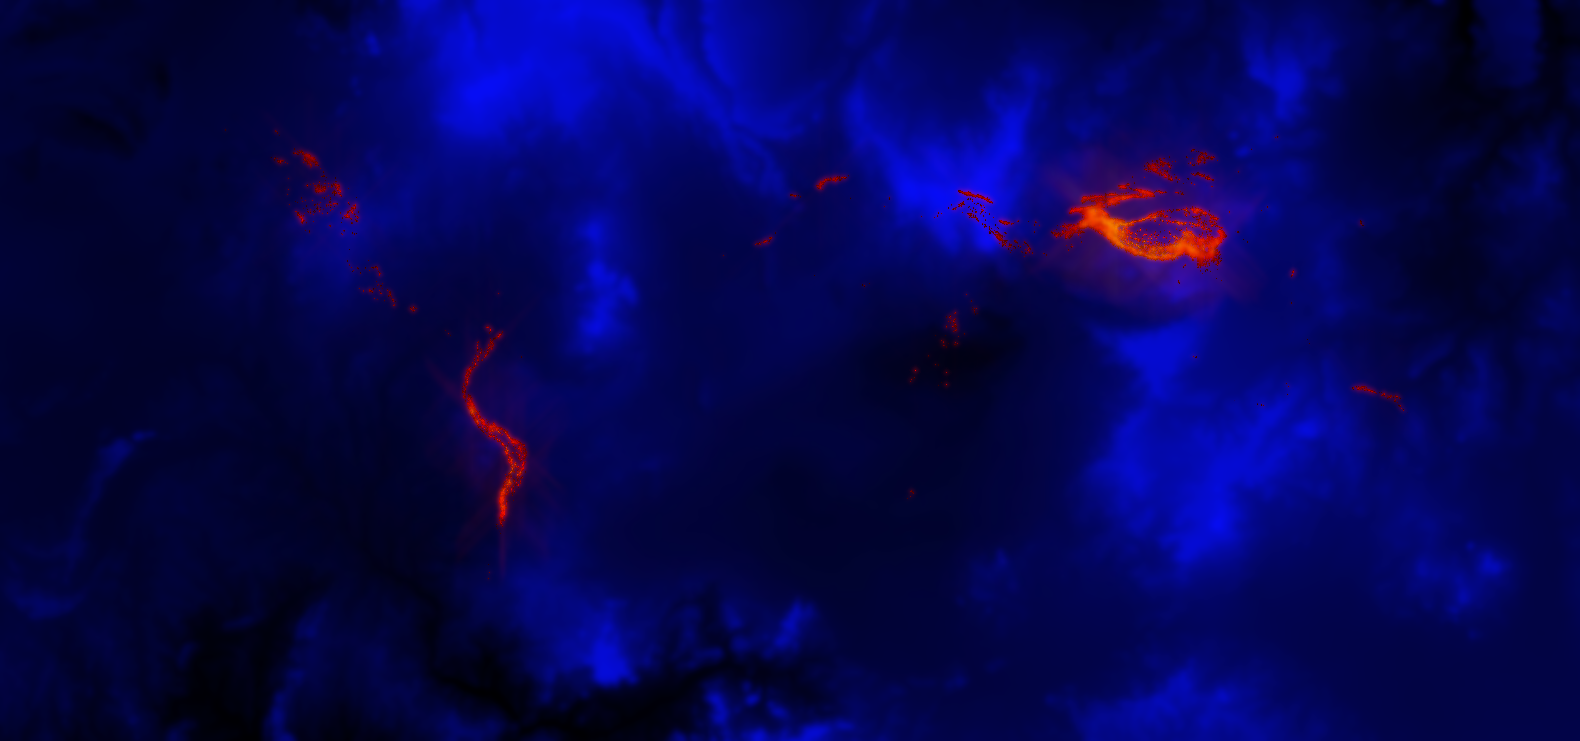
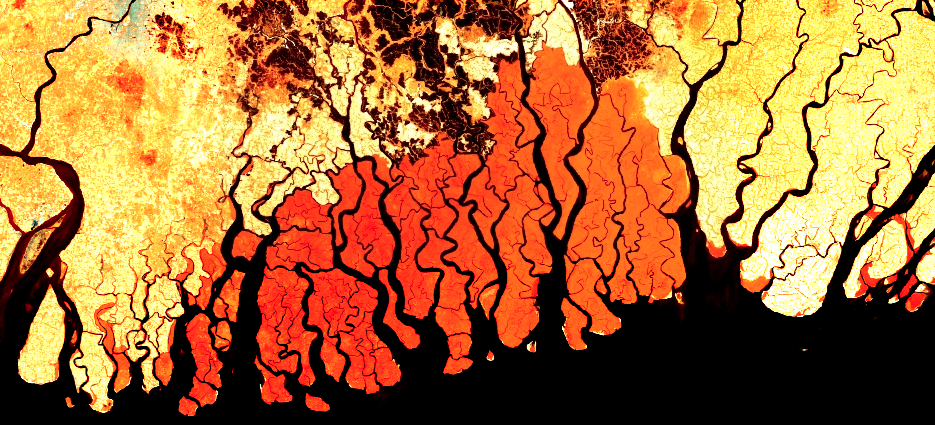
Week 55 (2022-08-11): SAR Changes in Madagascar
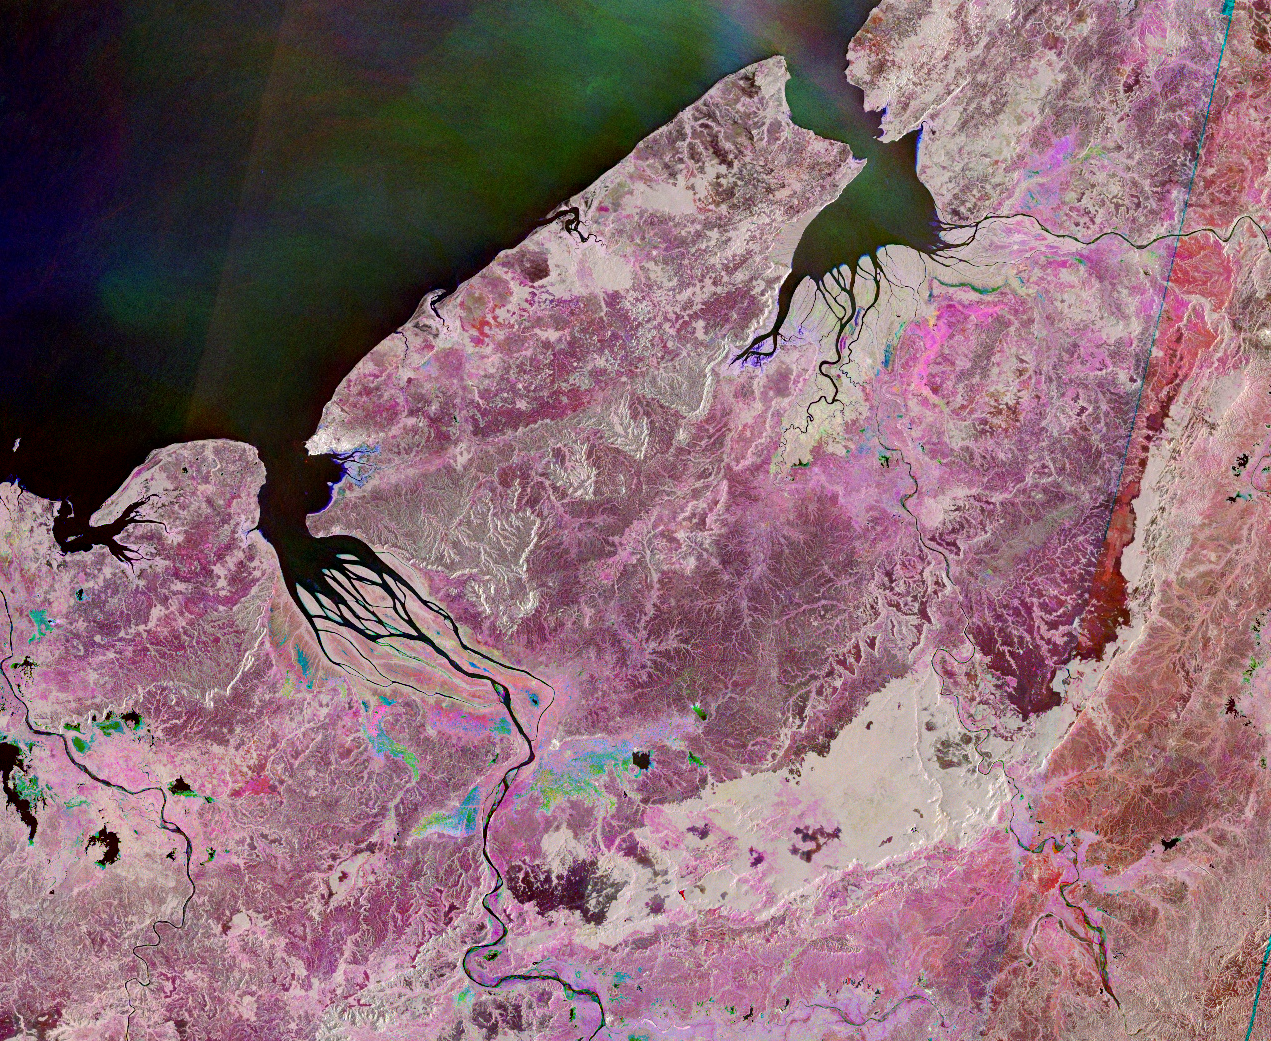
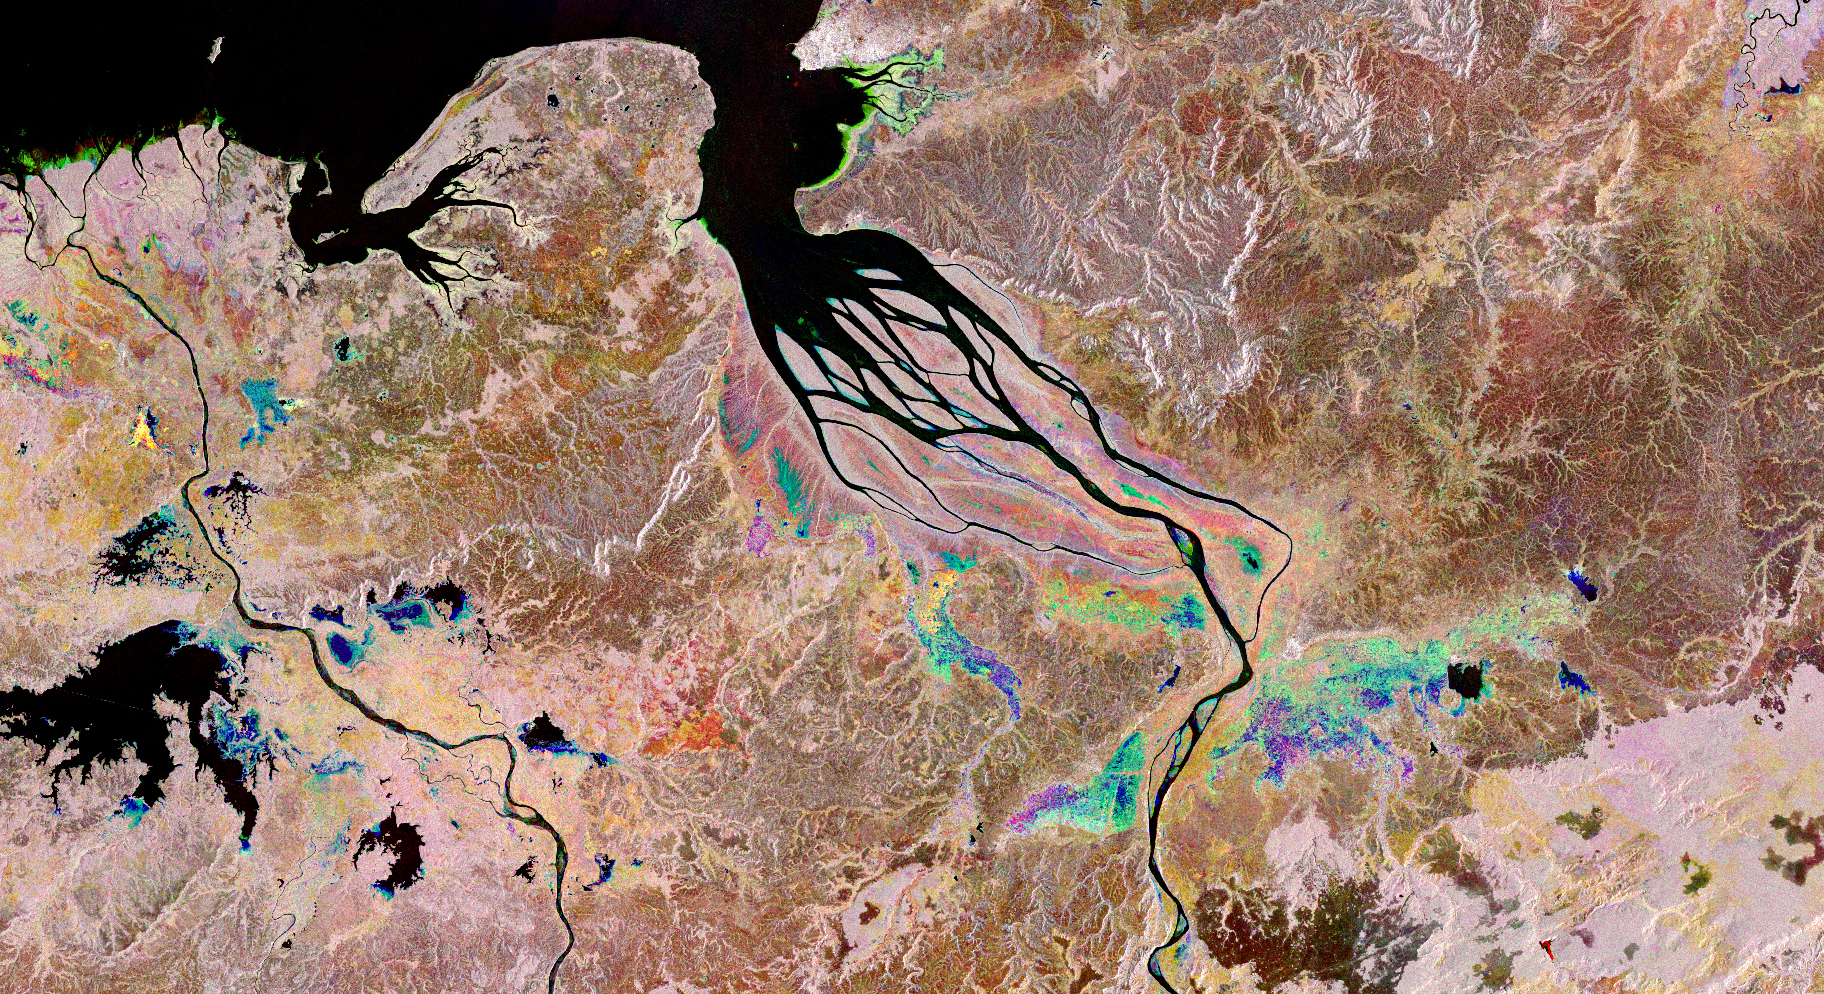
It’s been an off month but I’m back at it. These images show changes in the Betsiboka River Delta region of Madagascar 2015-2022 using Sentinel-1.
Inspired by the shutting down by @CopernicusEU #Sentinel1 B & @NASAEarth Earth Science Applications Week.
Also really liked this patterning on the water when using a different band visualization.
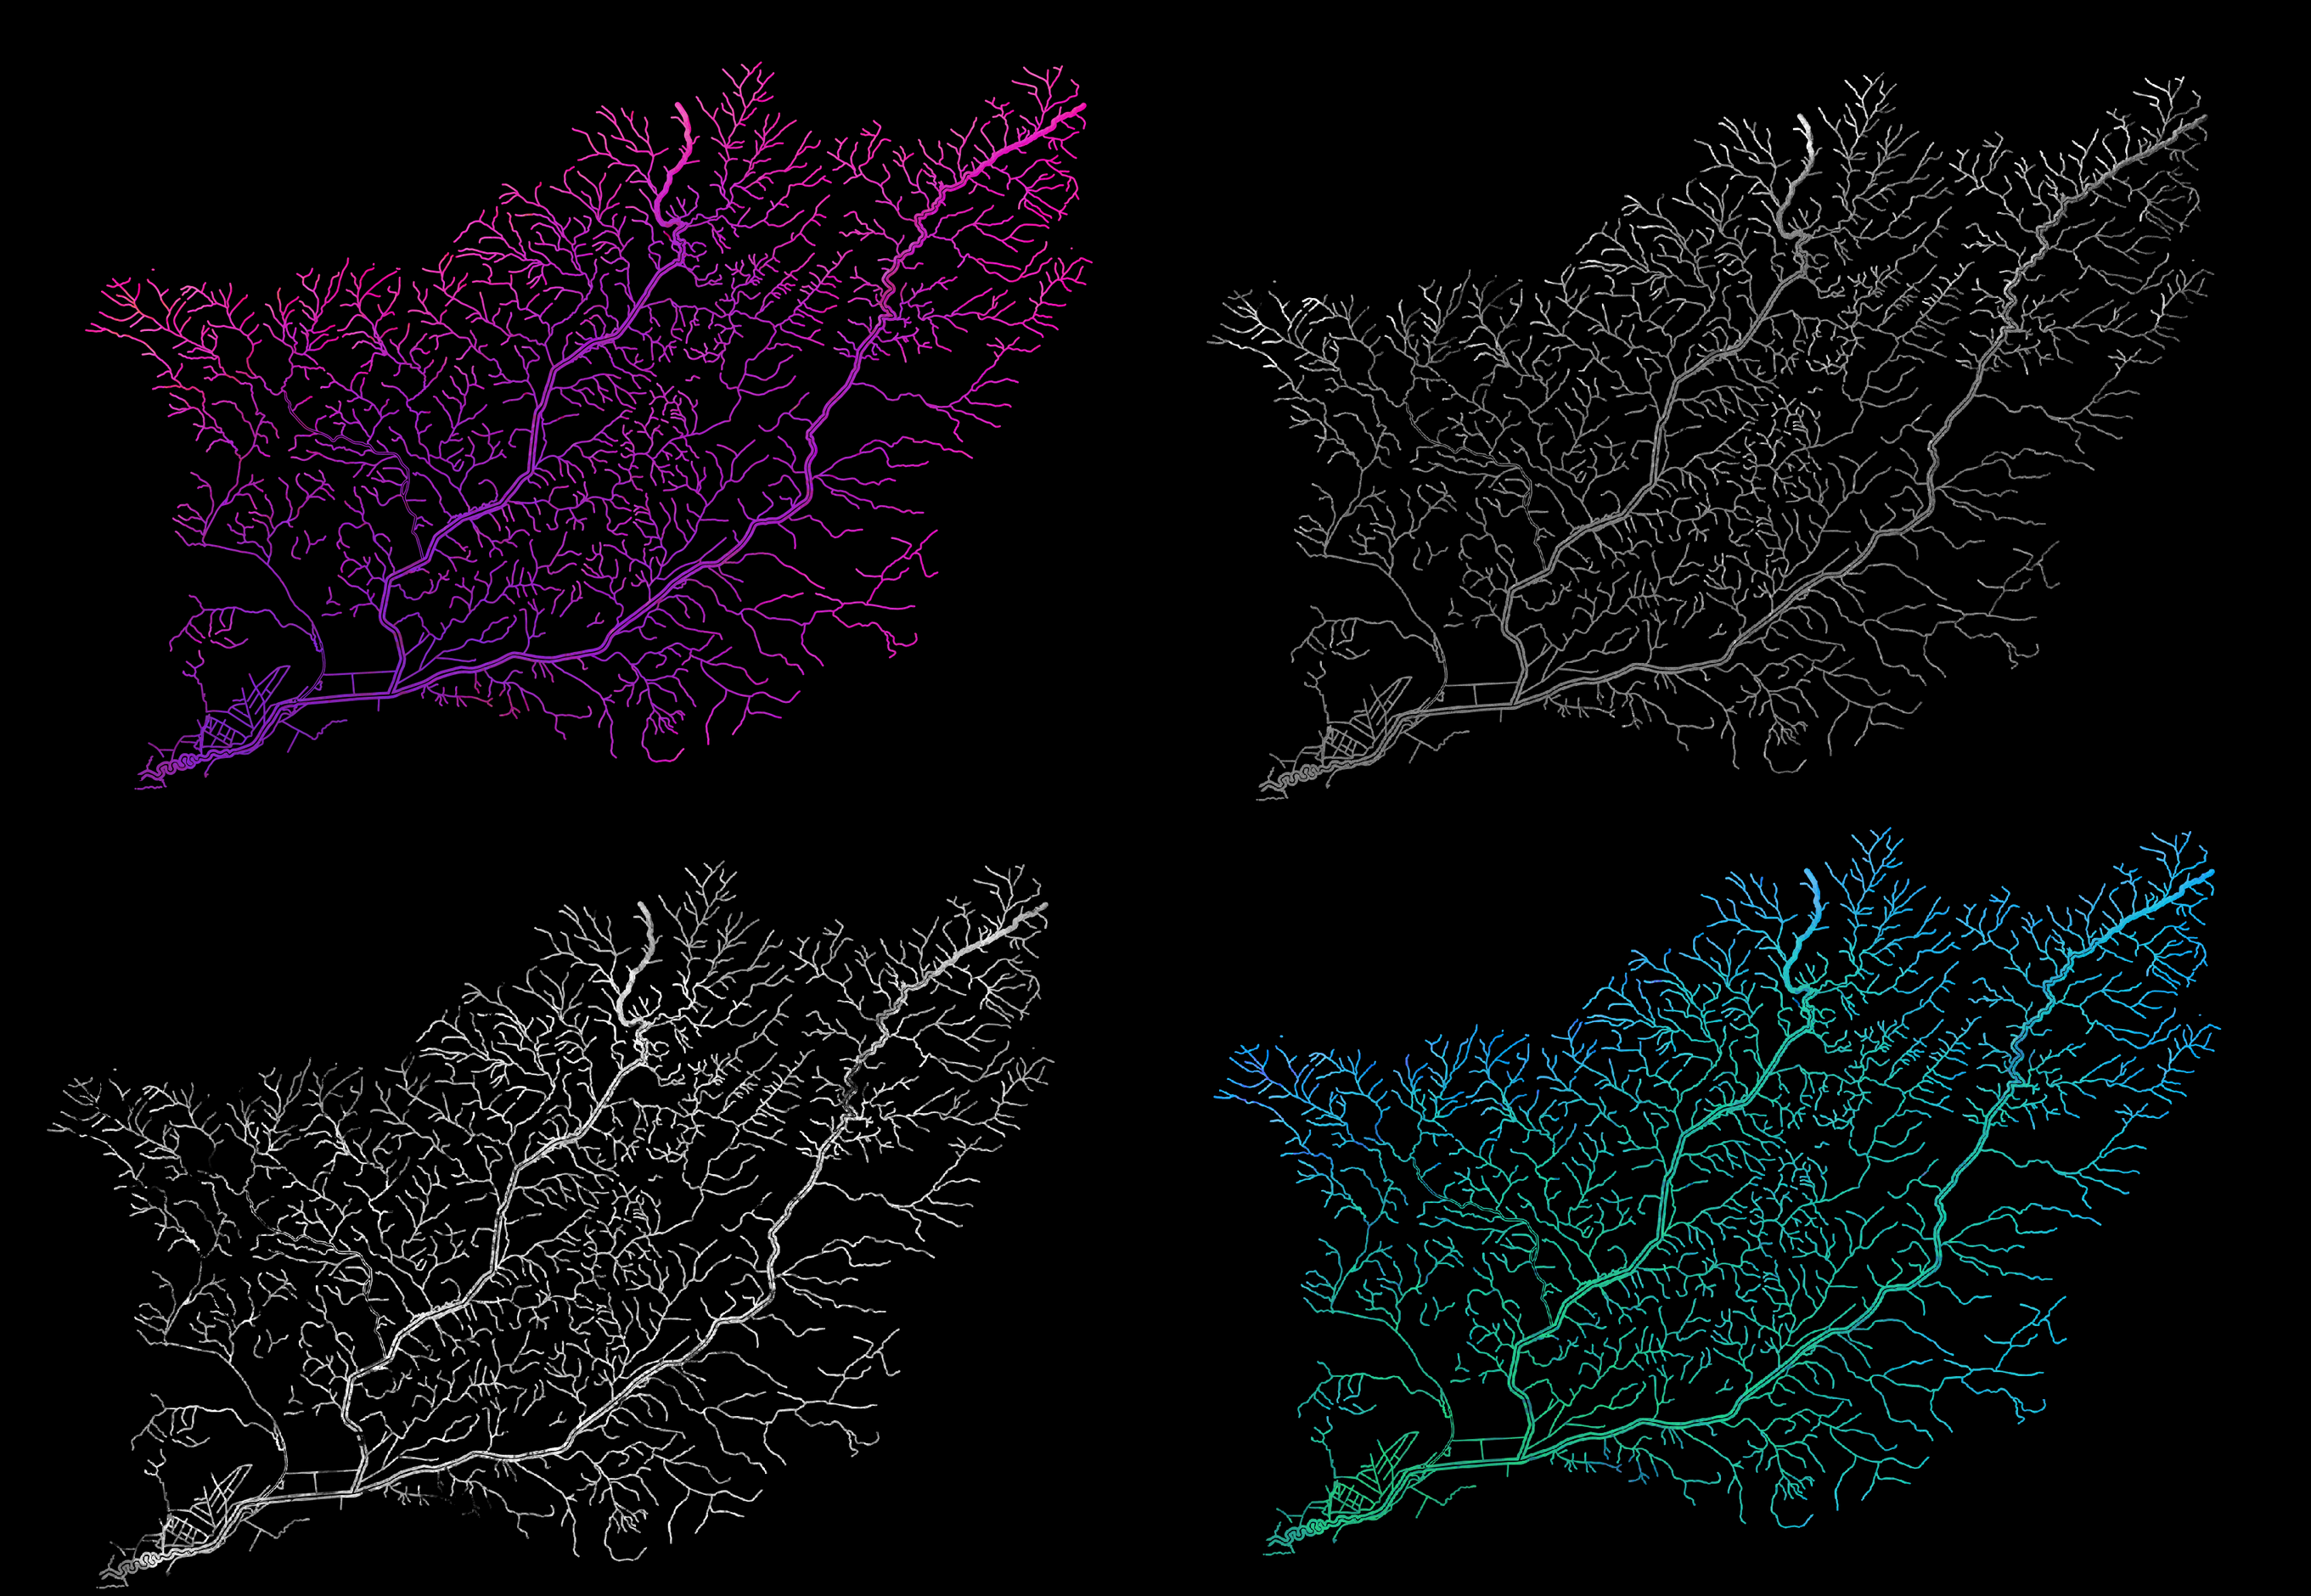
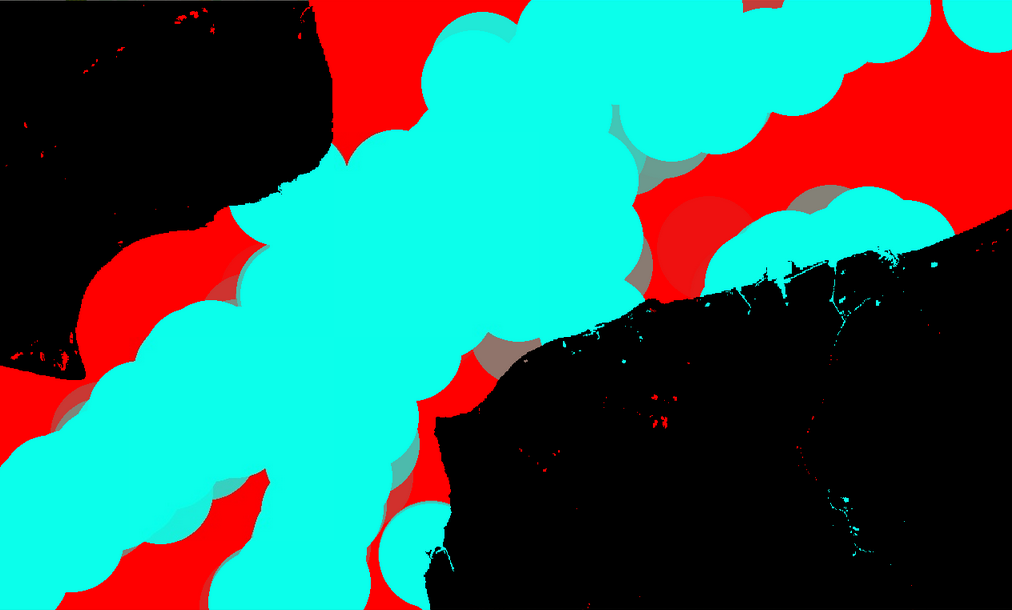
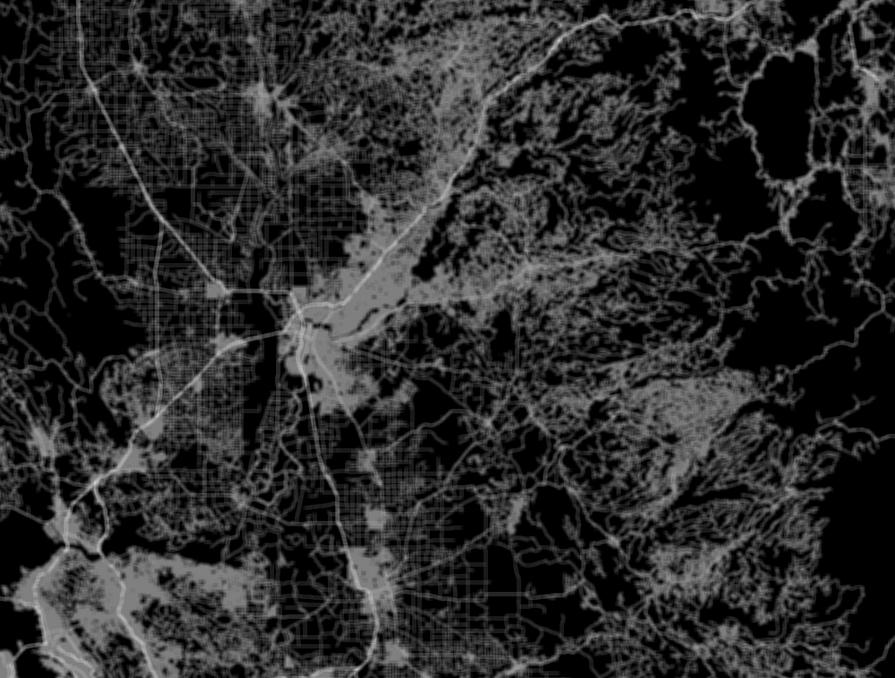
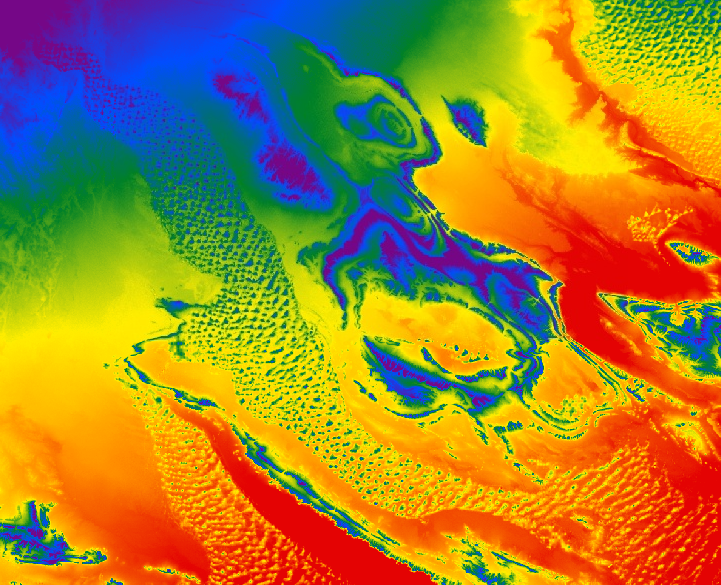
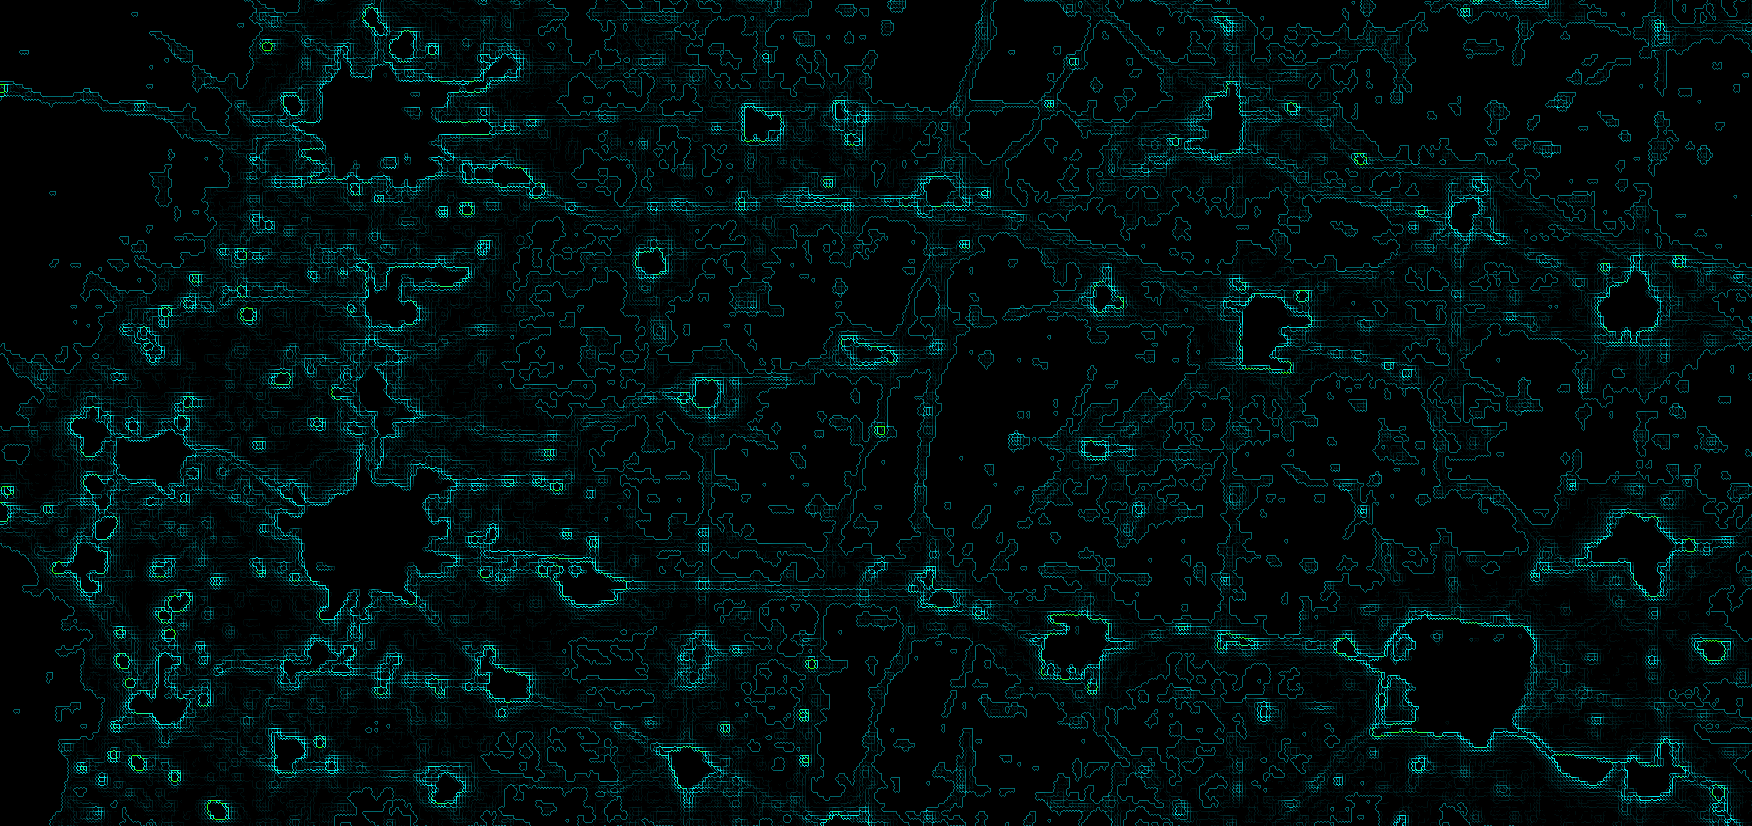
Week 54 (2022-07-12): 1m DEM Edge Detection in DC
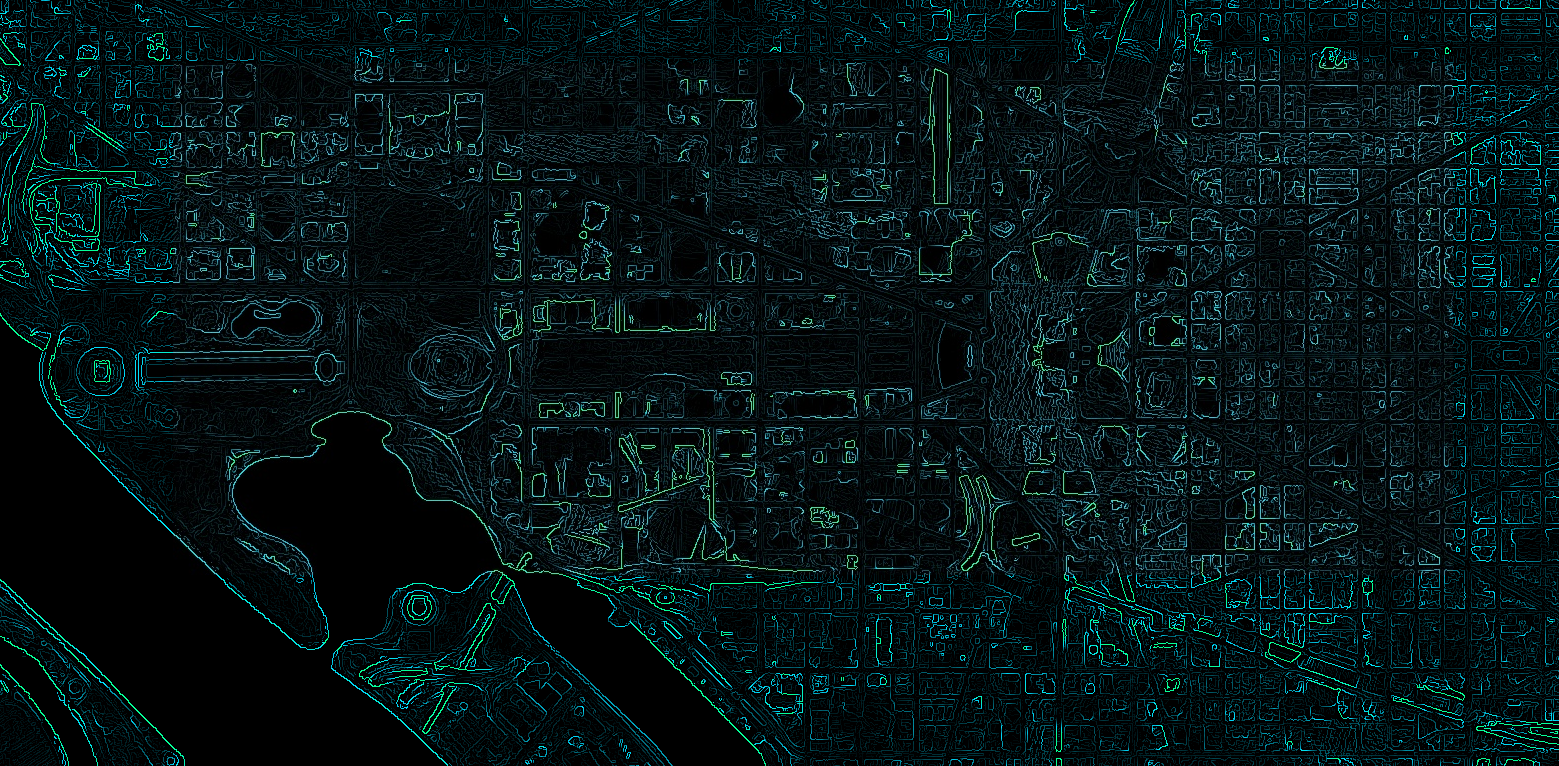
In commemoration of the #GRADcaucus launch and @Space_Leaders events on the Hill tomorrow, here is some edge detection on the new 1m DEM in ##EarthEngine, showing DC.
Thanks to @giswqs & @Exopixelist for flagging the new dataset!
I also liked this cloudy view of the area east of the Hill to the river.
Week 53 (2022-06-23): Red Sedona Timelapse
A mockup of a human settlement on Mars? Nope! Just Sedona, Arizona with the reds heightened just a bit! Using @USGSLandsat.
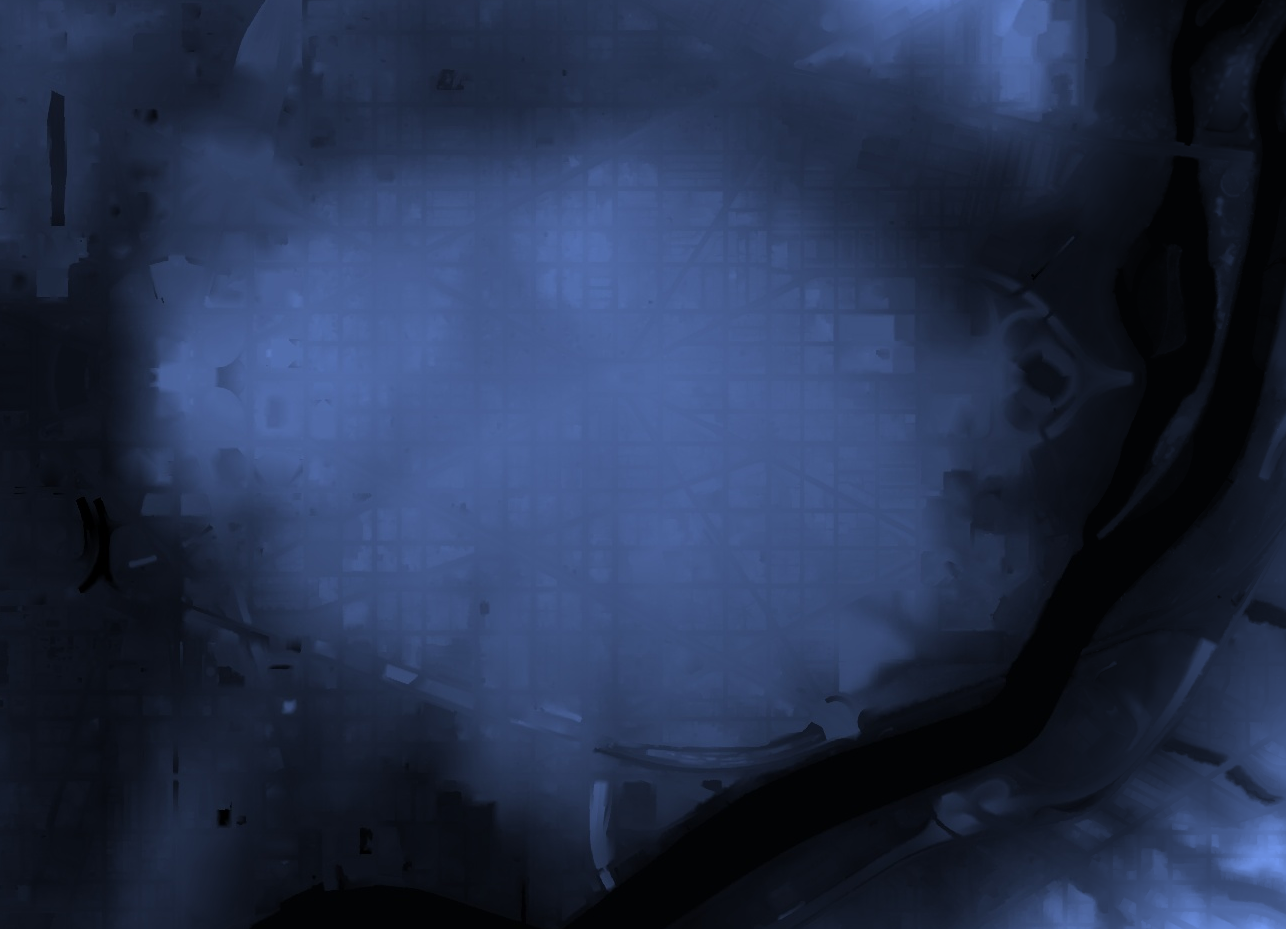
Week 52 (2022-06-09): Grand Canyon
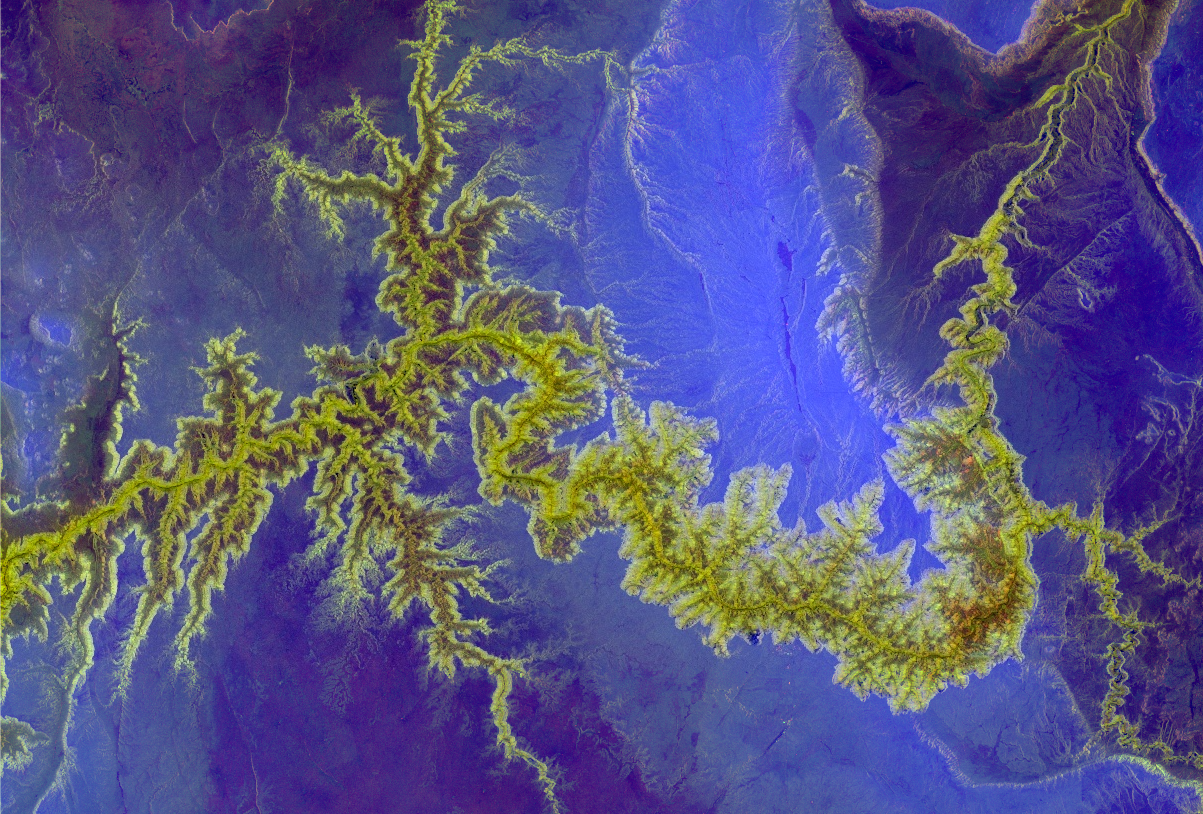
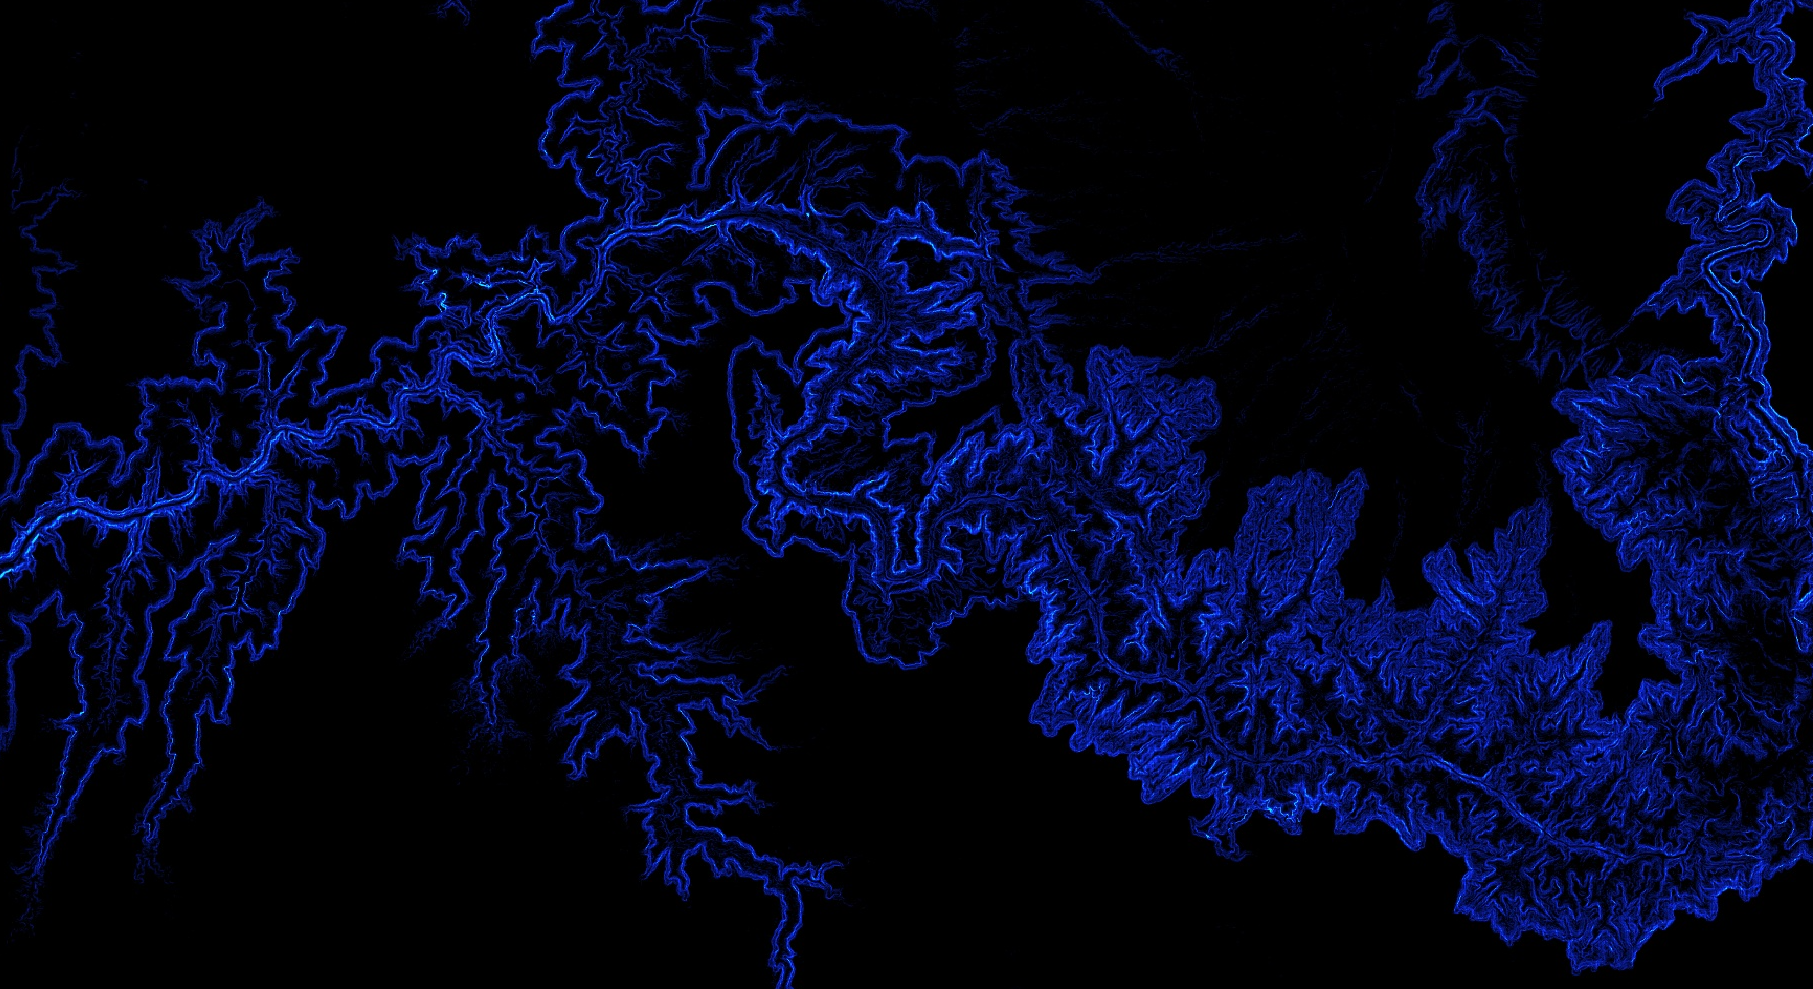
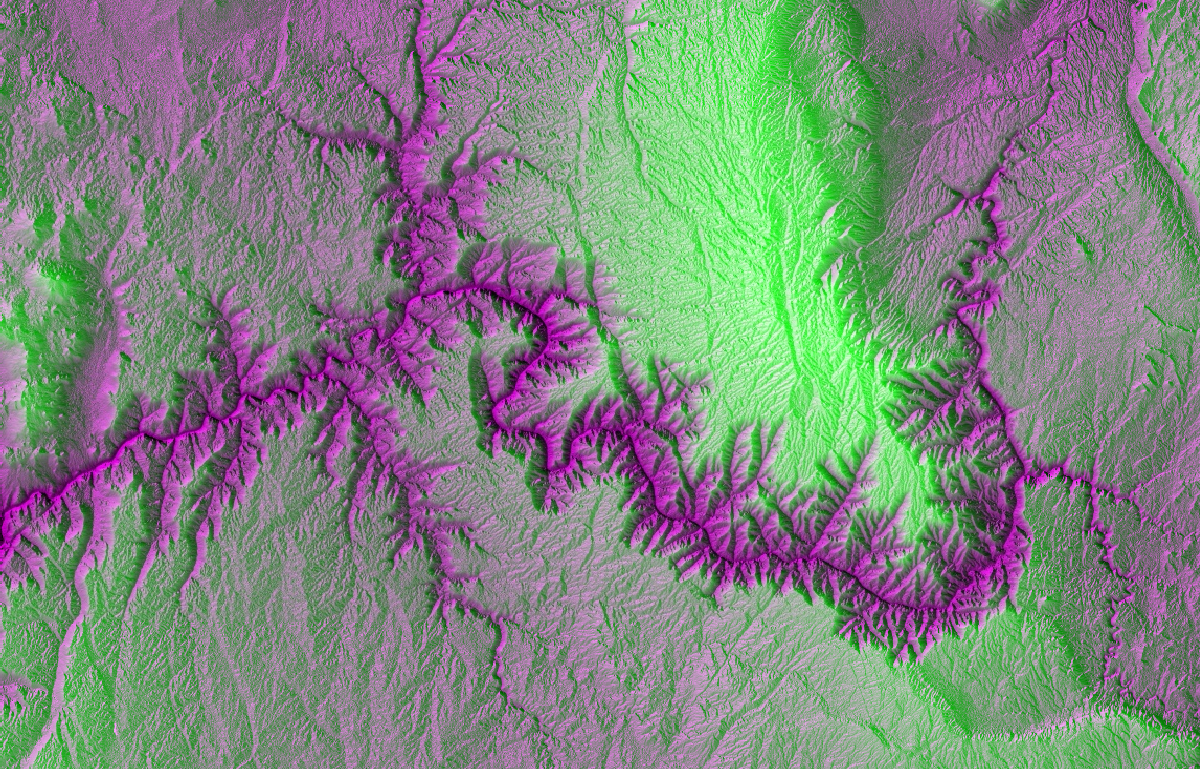
I’m headed to northern Arizona next week, so I thought I would revisit the very first EO imagery I worked with: the Grand Canyon. These were made with various combinations of SRTM and @ESA_EO #Sentinel 1 SAR.
Week 51 (2022-06-02): Pride Month 2
![]()
A few pride-inspired pieces using @ESA_EO #Sentinel 1 SAR, @USGSLandsat 8, and ASTER from @NASAEarth’s Terra. Gonna be honest, some of these color palettes are easier to work with than others.
Week 50 (2022-05-26): GOES Nighttime Noise [Flashing Lights Warning]

I was messing around with @NOAASatellites’ #GOES17 again & found out that nighttime noise makes some weird / fascinating patterns. This is a similar time and area as week 39, with the visualization range compressed almost to zero.
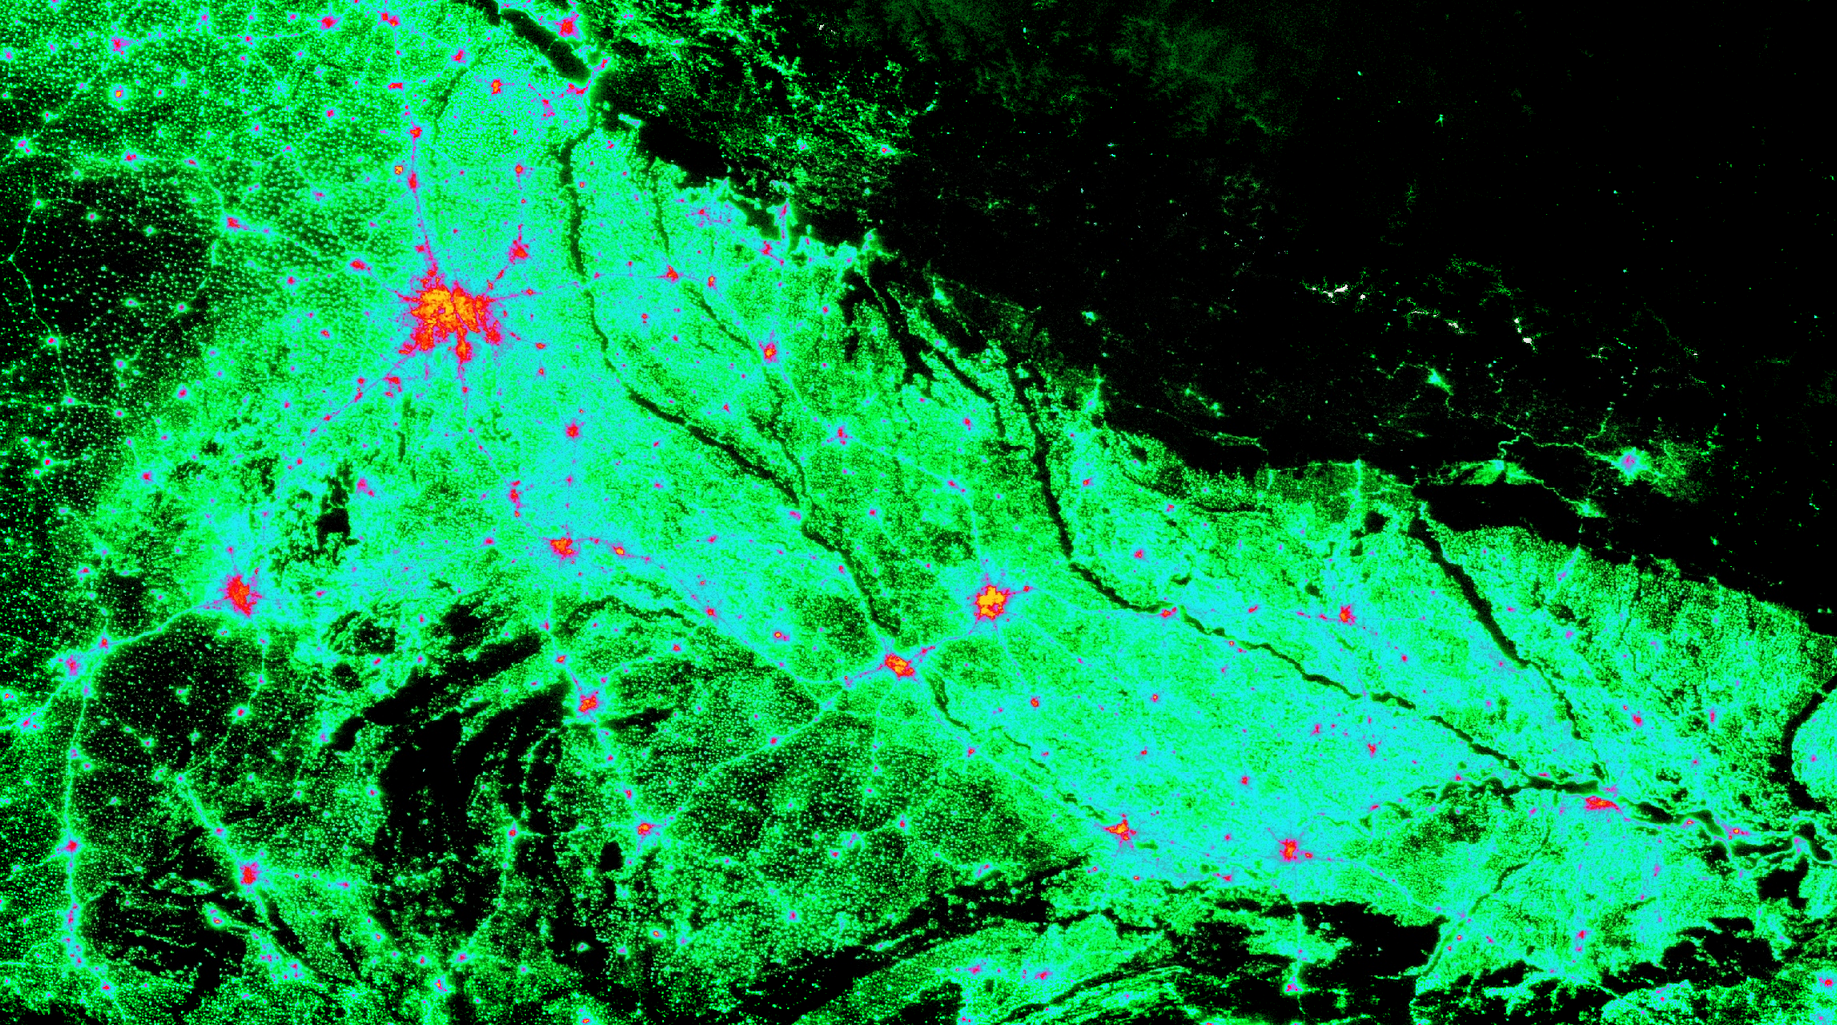
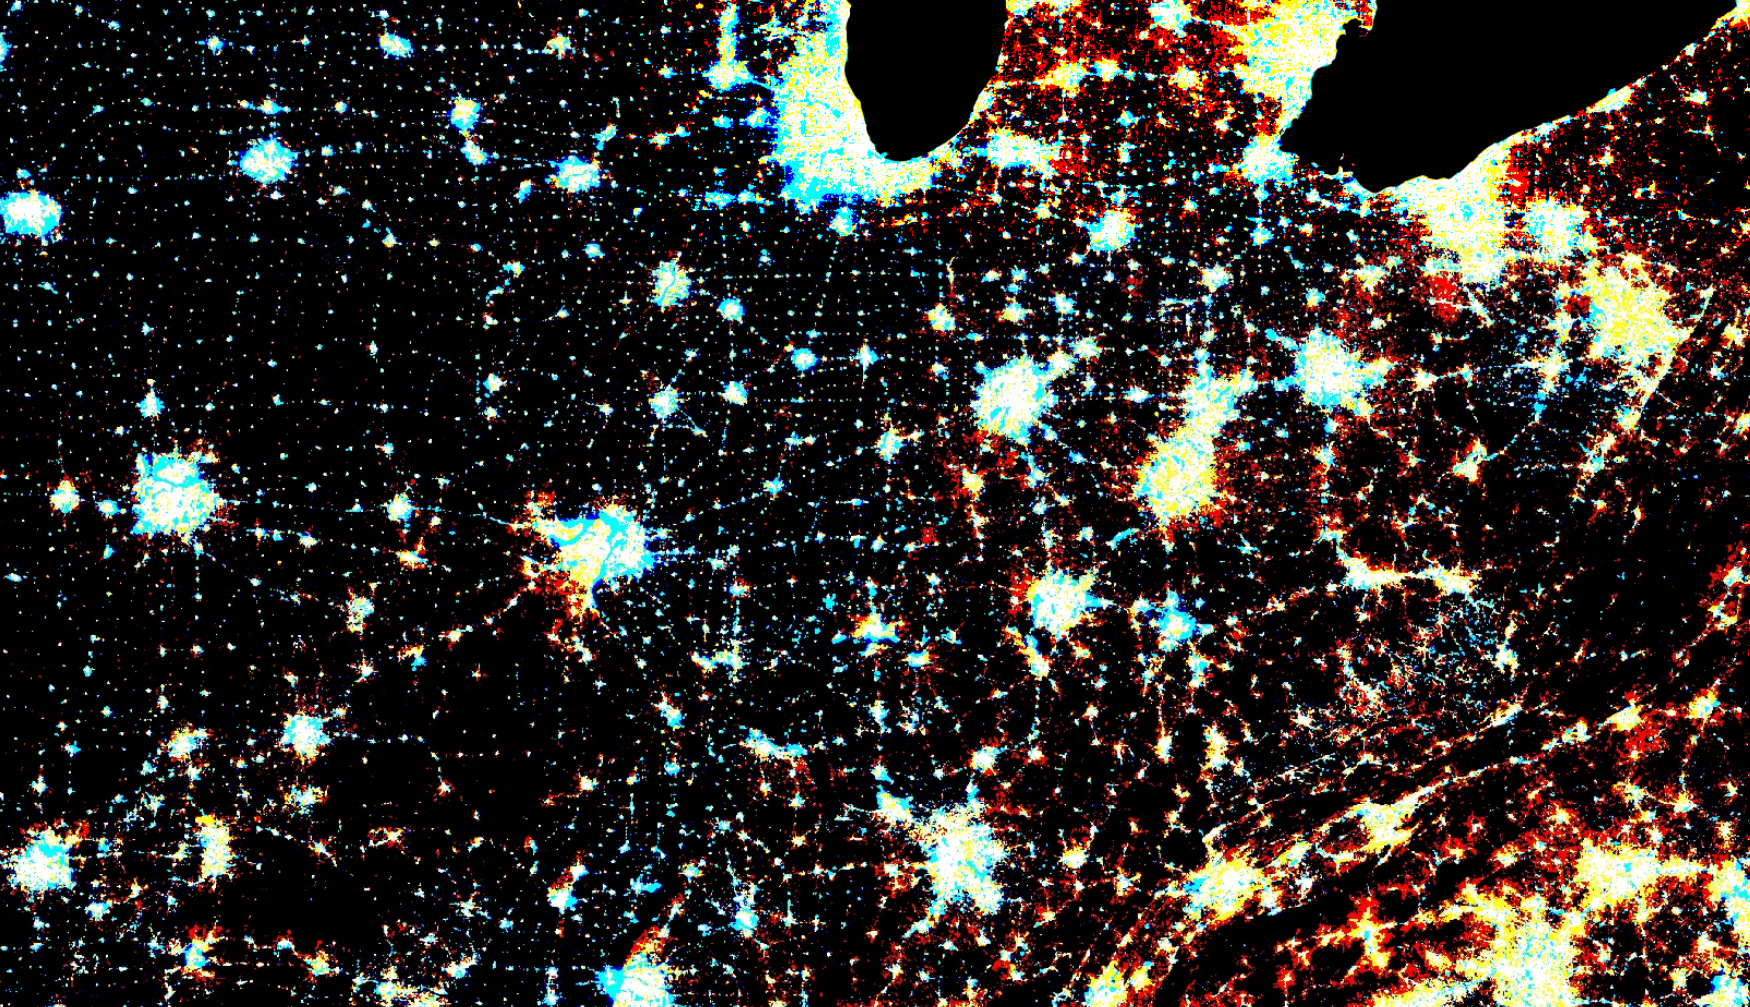
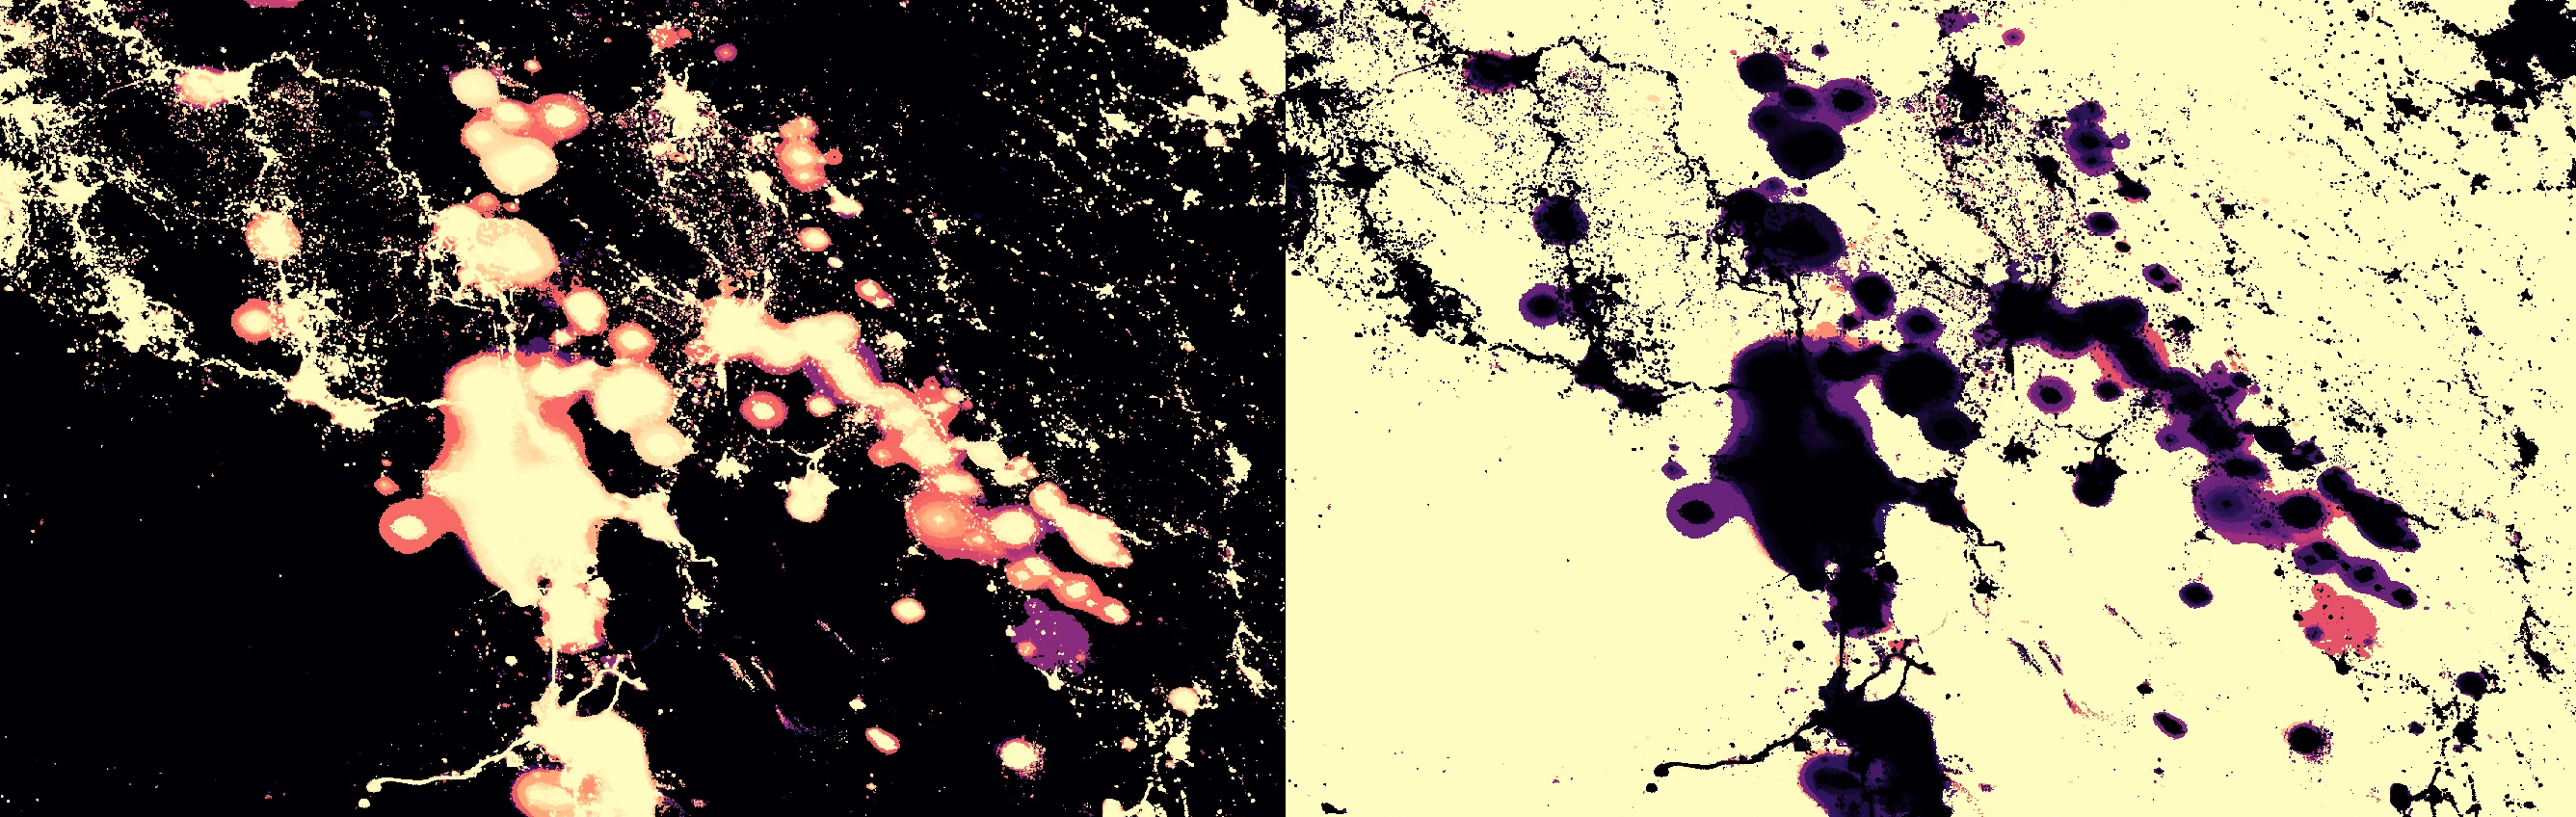
Week 49 (2022-05-19): Ukraine Nightlights
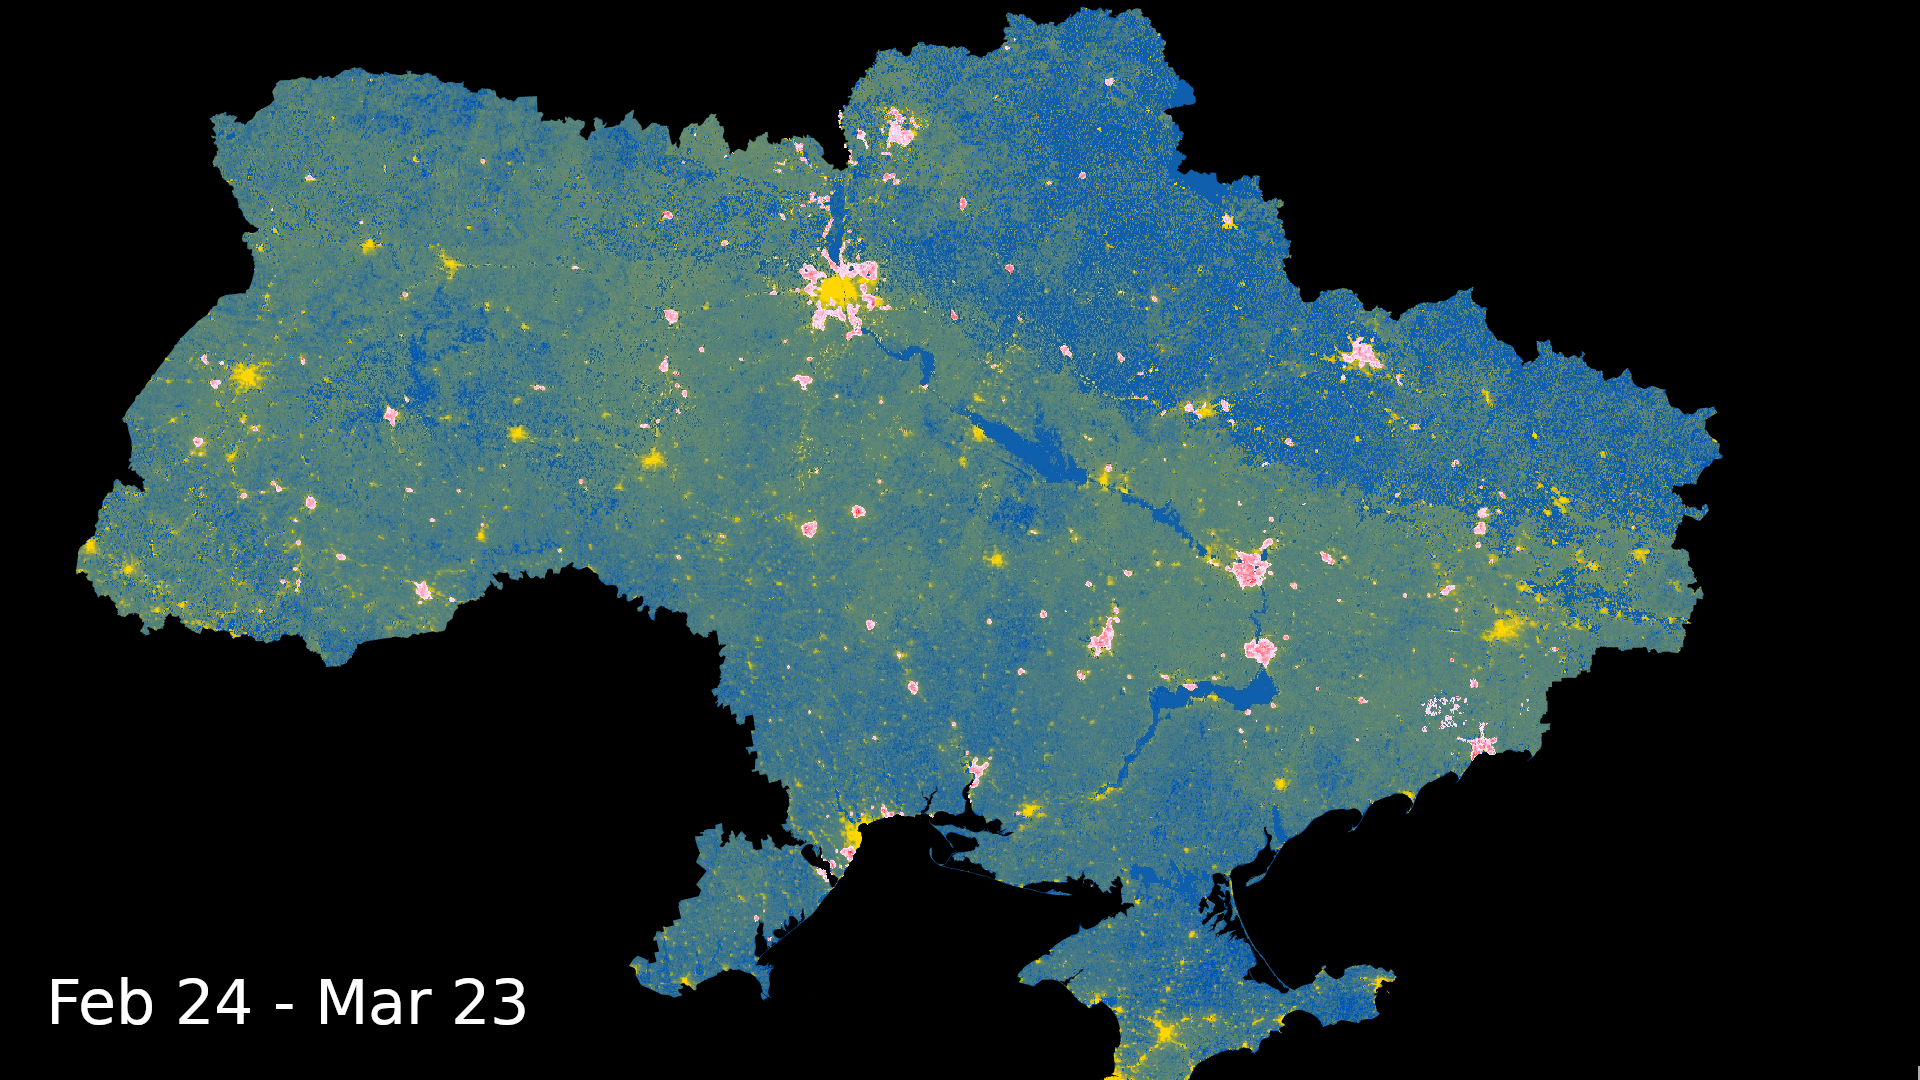
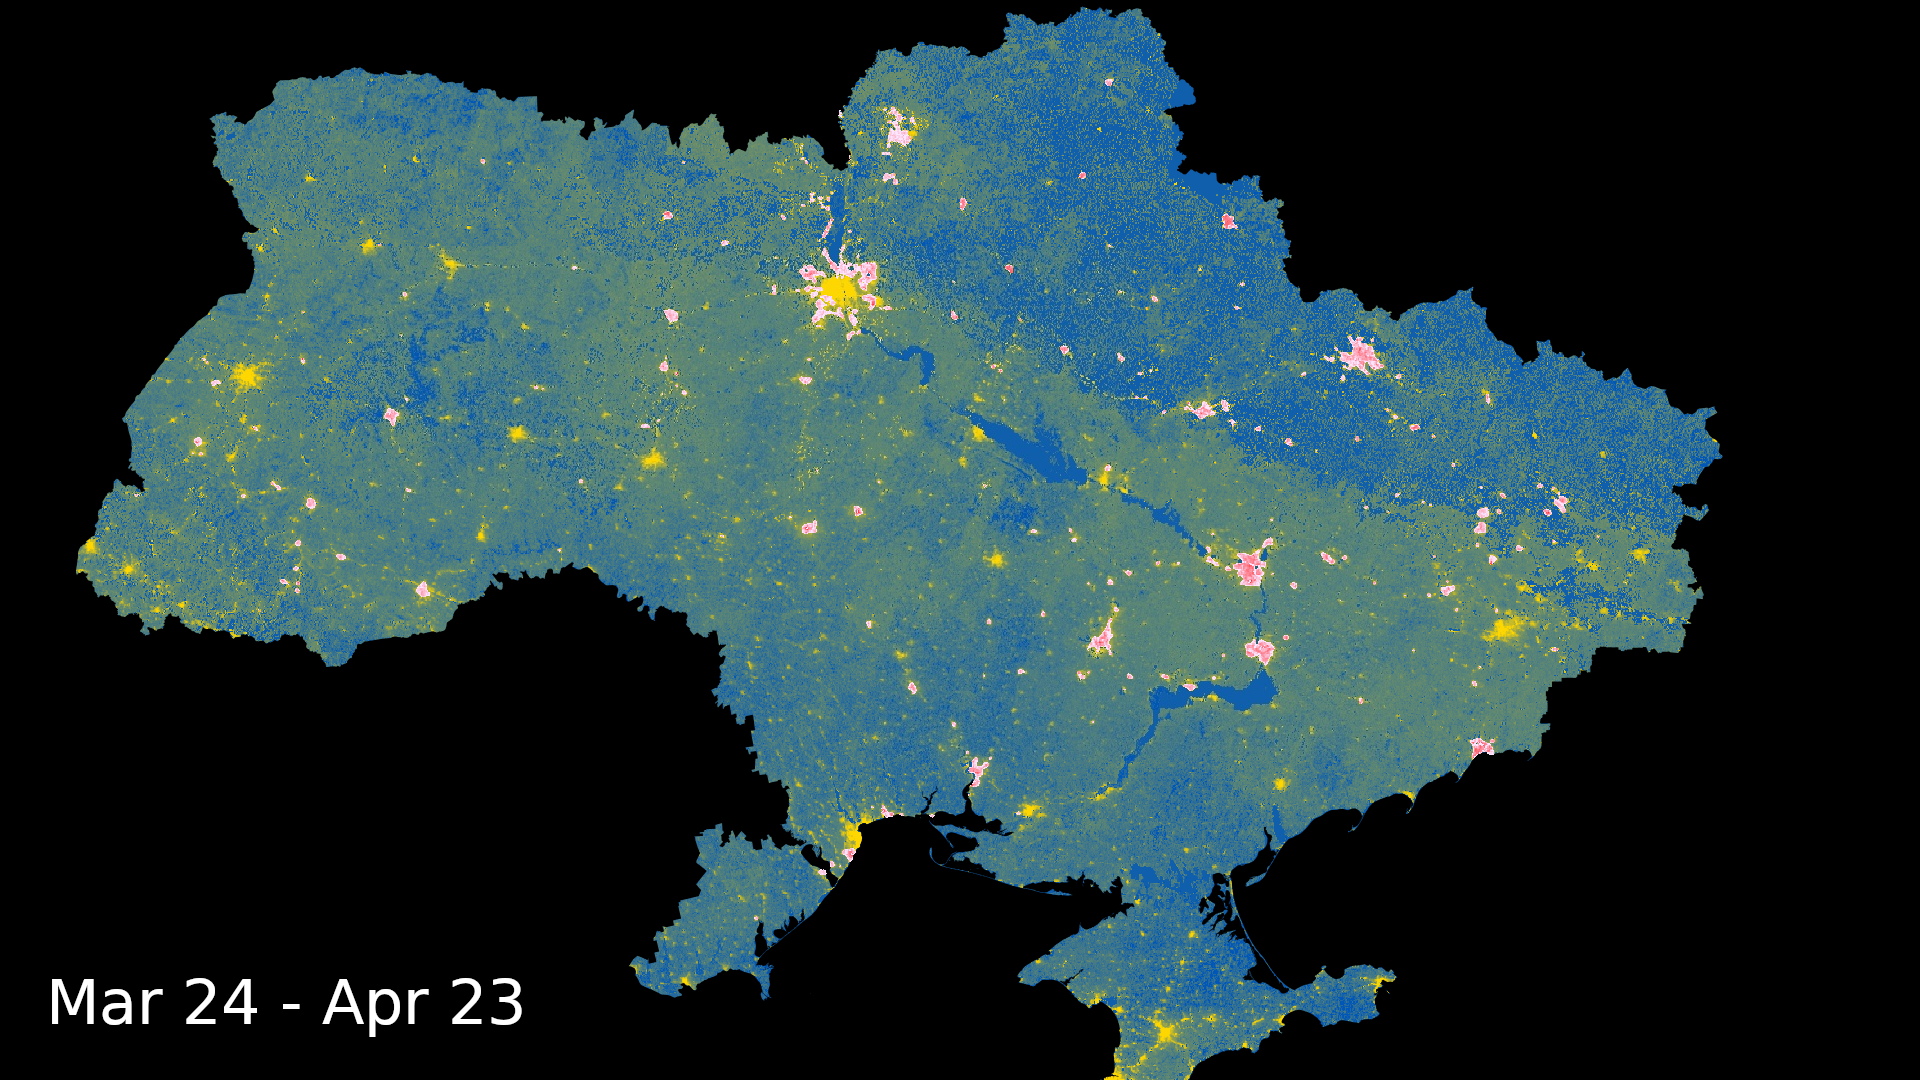
Took a week off due to family visiting. This week is showing median decreases (shown in pink-red) in nightlights (yellow) in Ukraine during the first two months of the invasion compared to pre-invasion, using the @NASAEarthData VIIRS VNP46A2 dataset.
Week 48 (2022-05-05): Farm Comparison
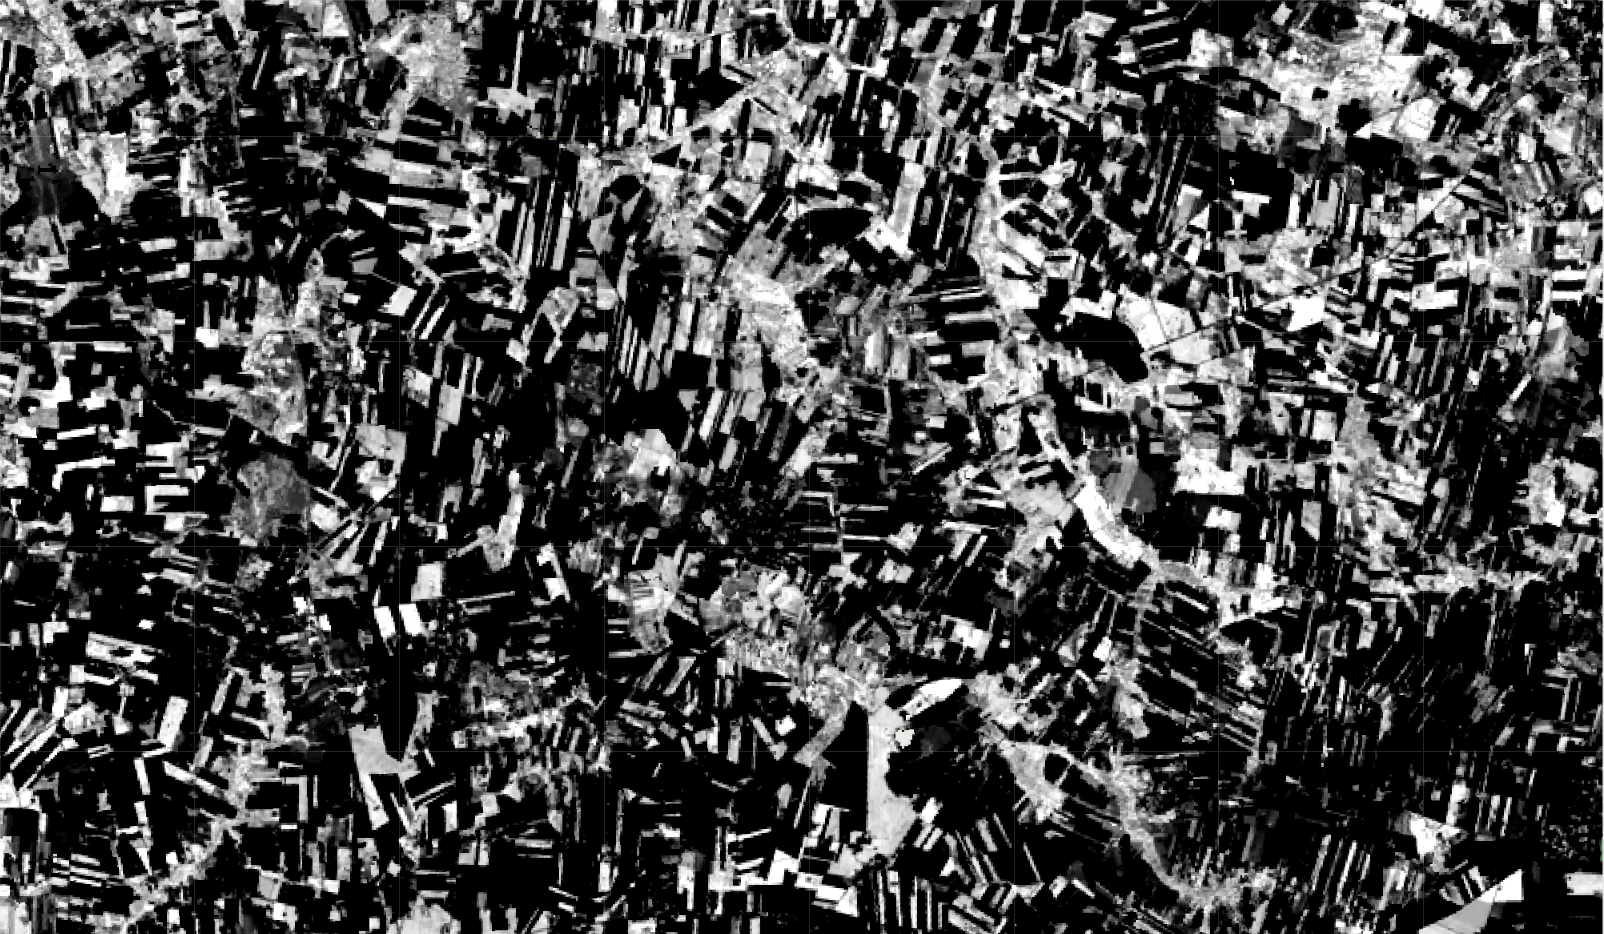
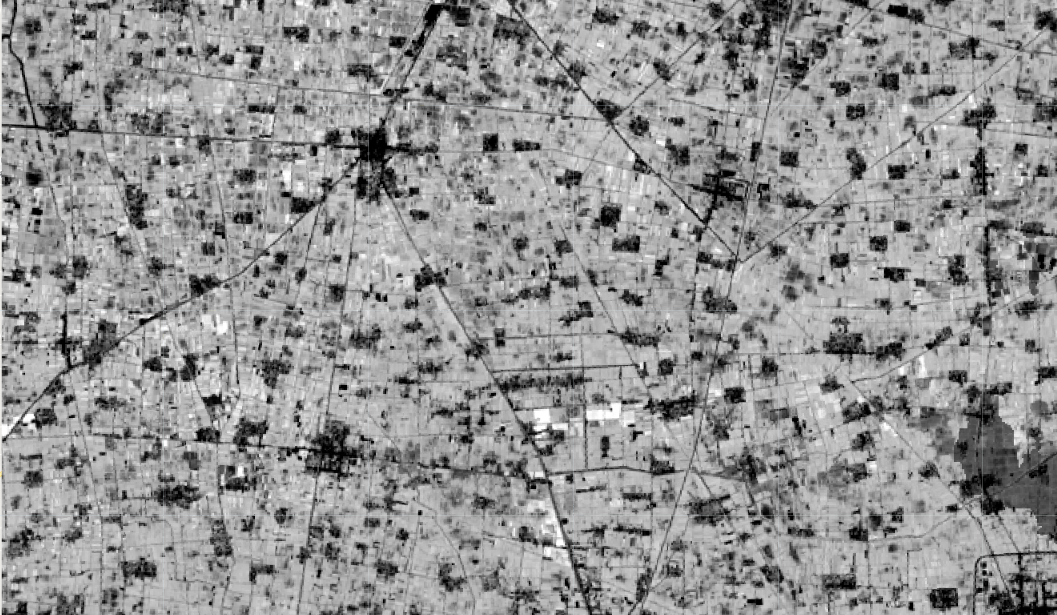
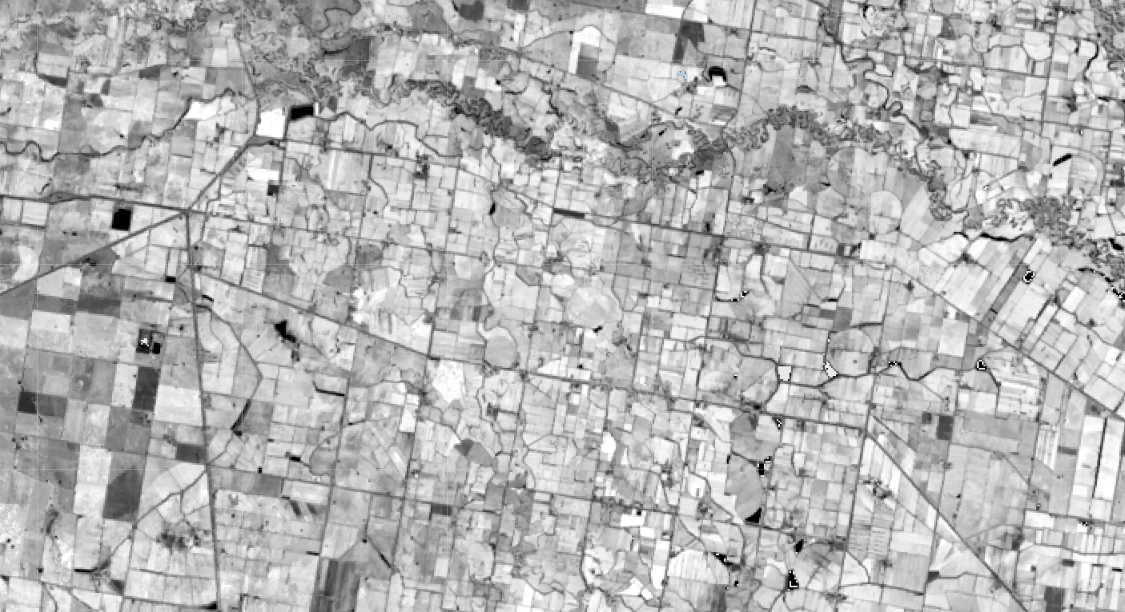
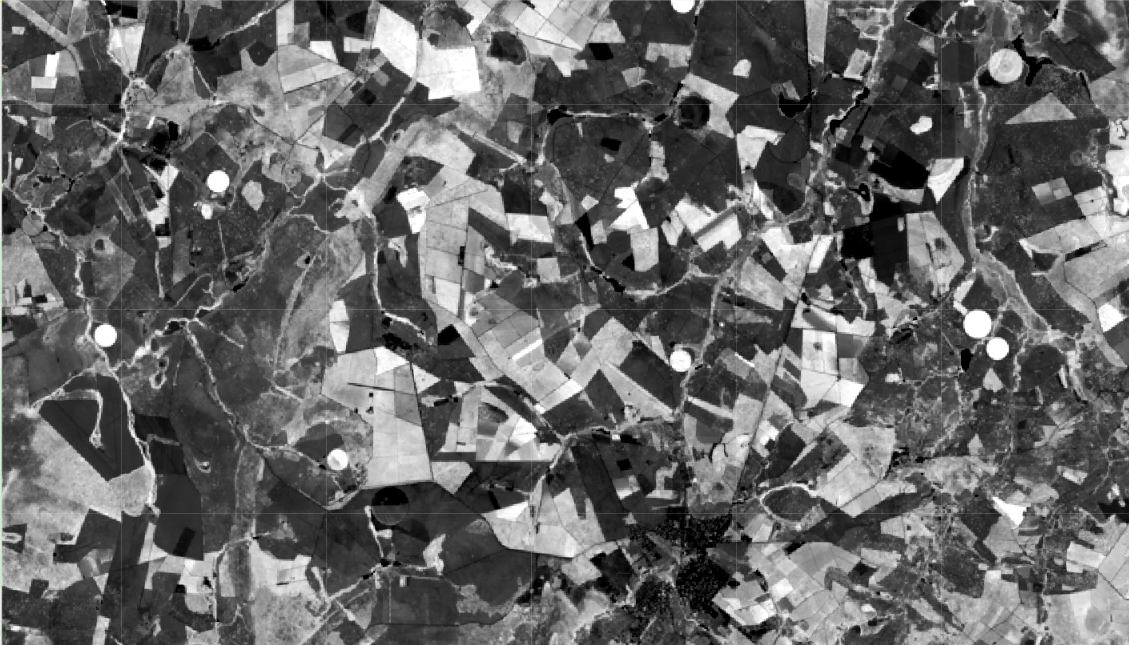
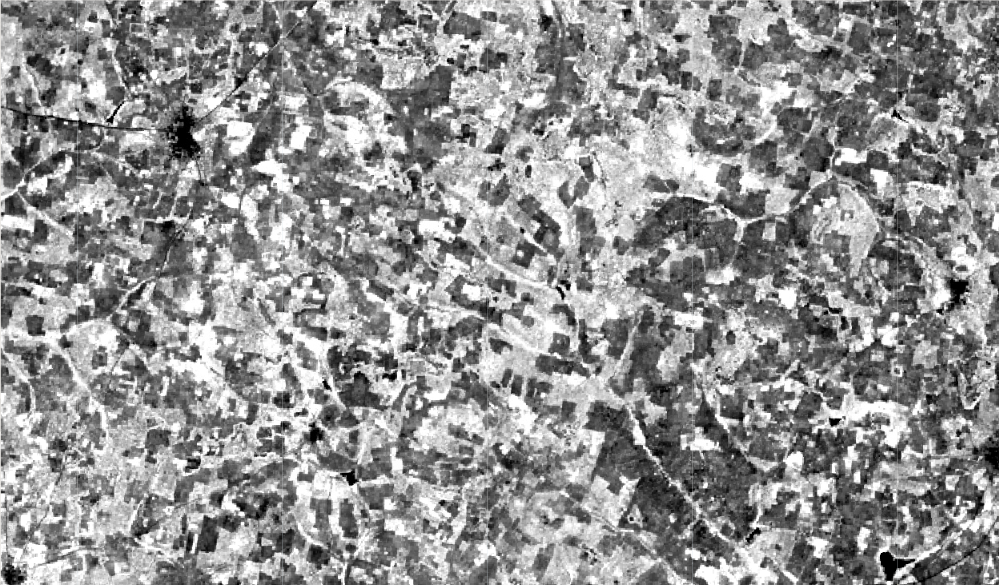
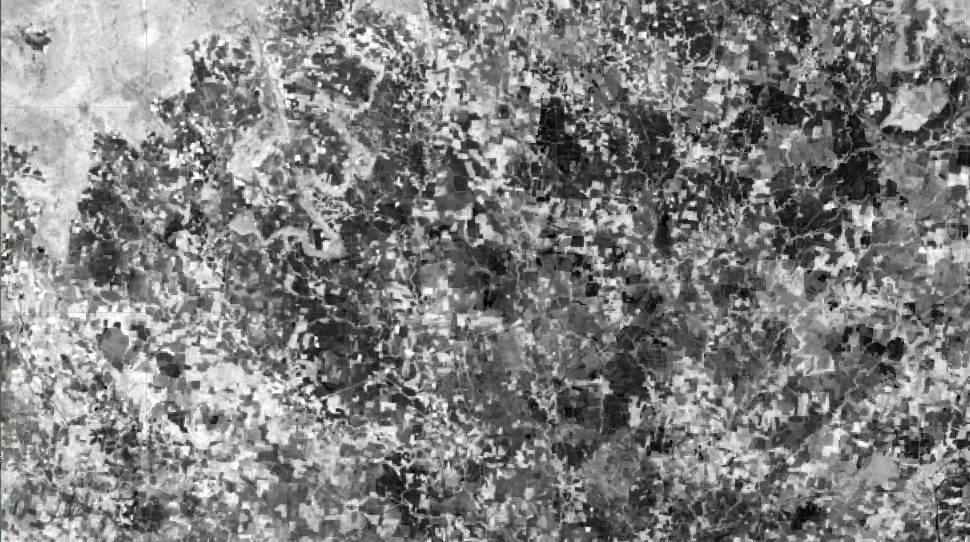
Here are 8 @USGSLandsat 8 NDVI images of agricultural land from countries around the world (can you guess which is which?), all at the same scale. Really highlights the variation in land practices & potential dangers of training a ML model on just one region.
Week 47 (2022-04-28): Texas Open Street Map Distances
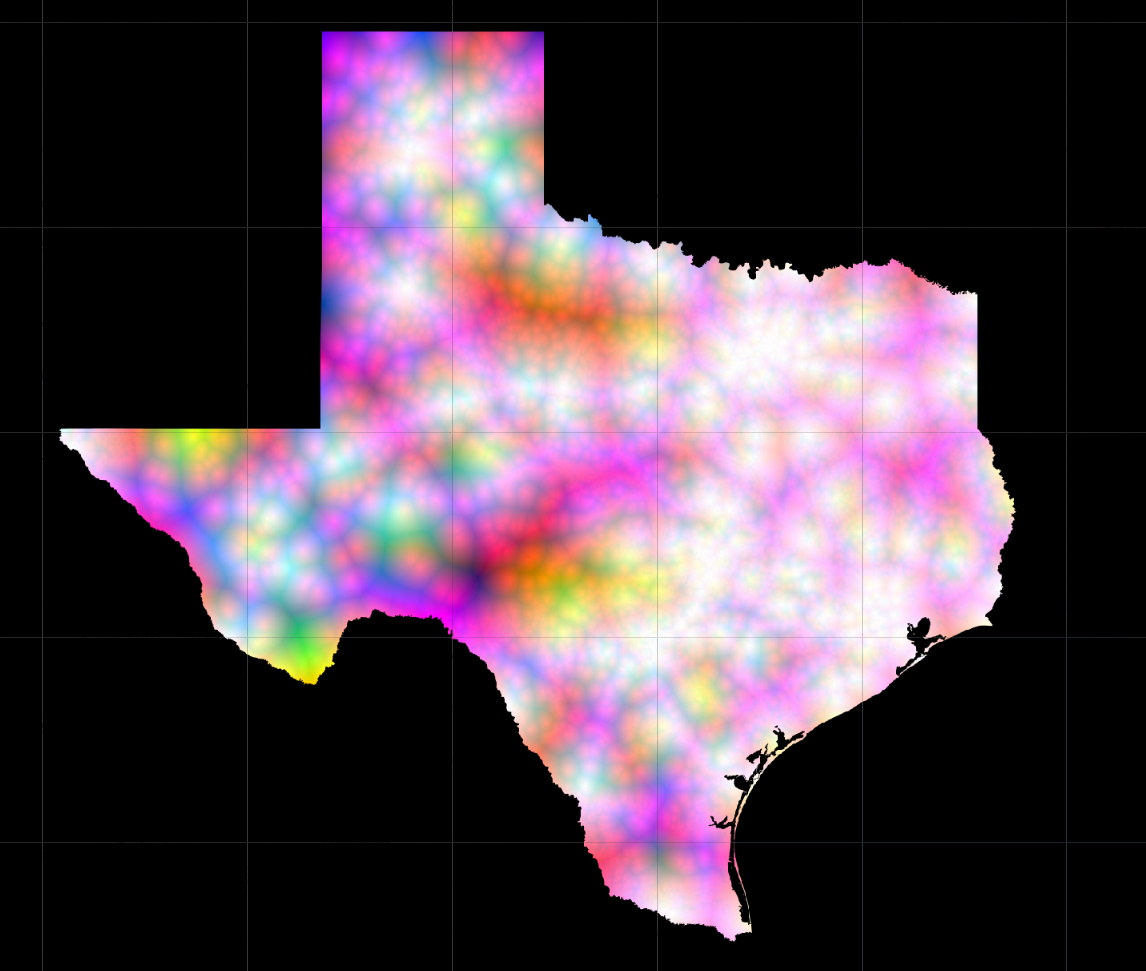
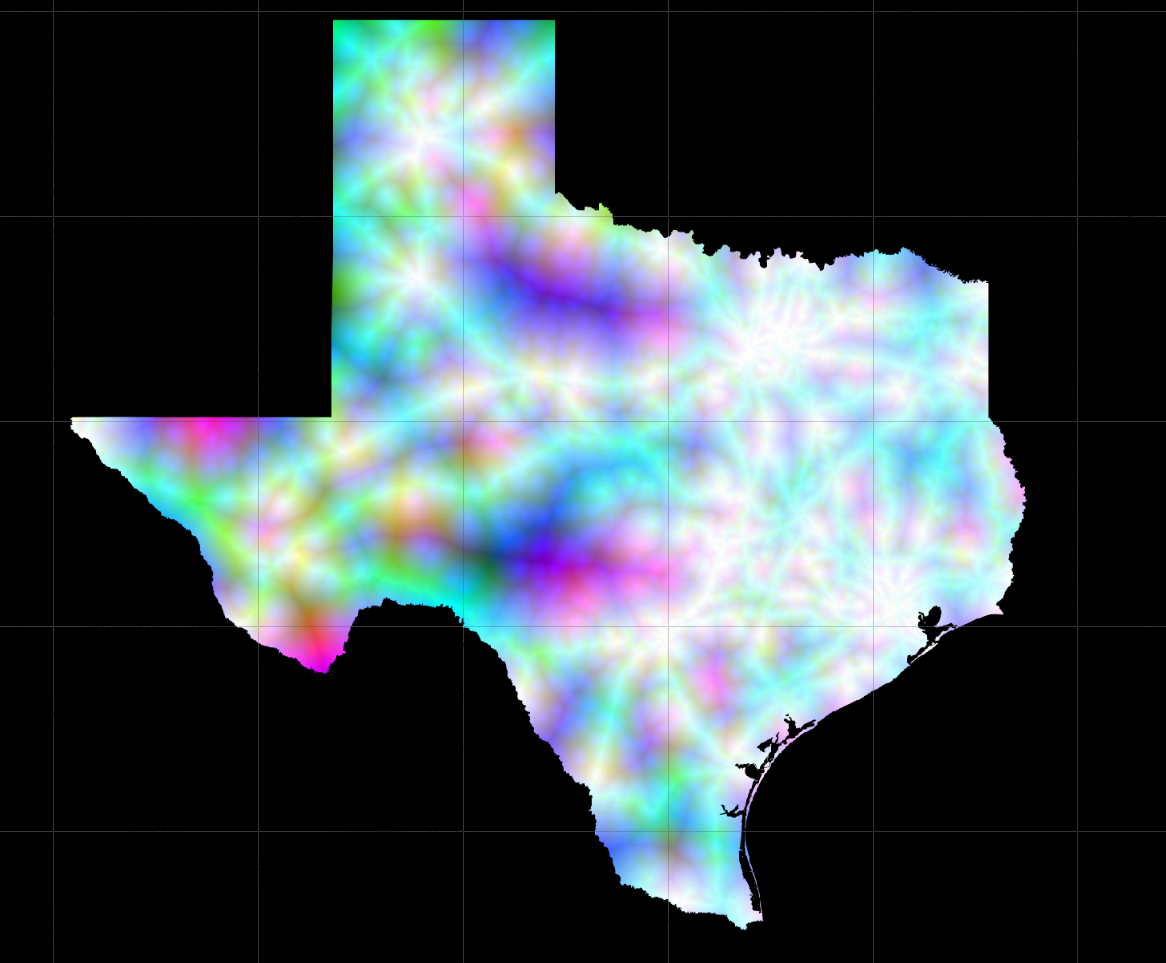
Playing around with data from @openstreetmap this week. These images are based on distances to railroads, bodies of water, and public toilets in Texas. Are those pretty arbitrary? Definitely.
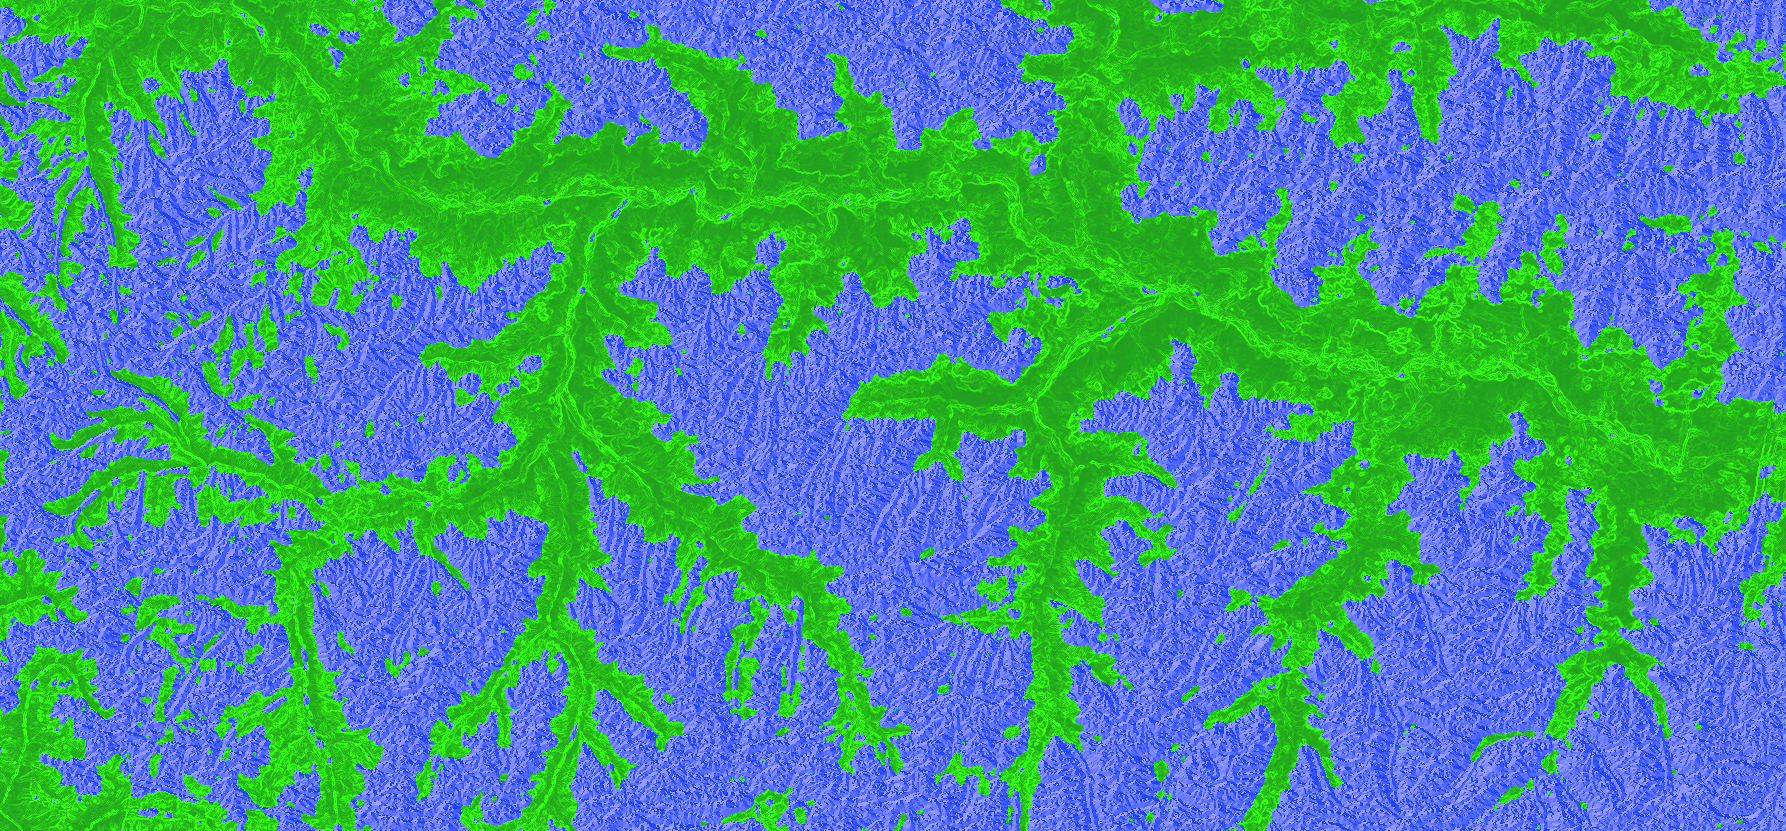
Week 46 (2022-04-21): ALOS & Landcover
Nothing technically fancy this week, just combining some datasets that weren’t probably intended to be combined. These use Conservation Science Partners (https://www.csp-inc.org/) ALOS Topographic Diversity & Global Human Modification datasets, plus the @CopernicusEU Global Land Service.
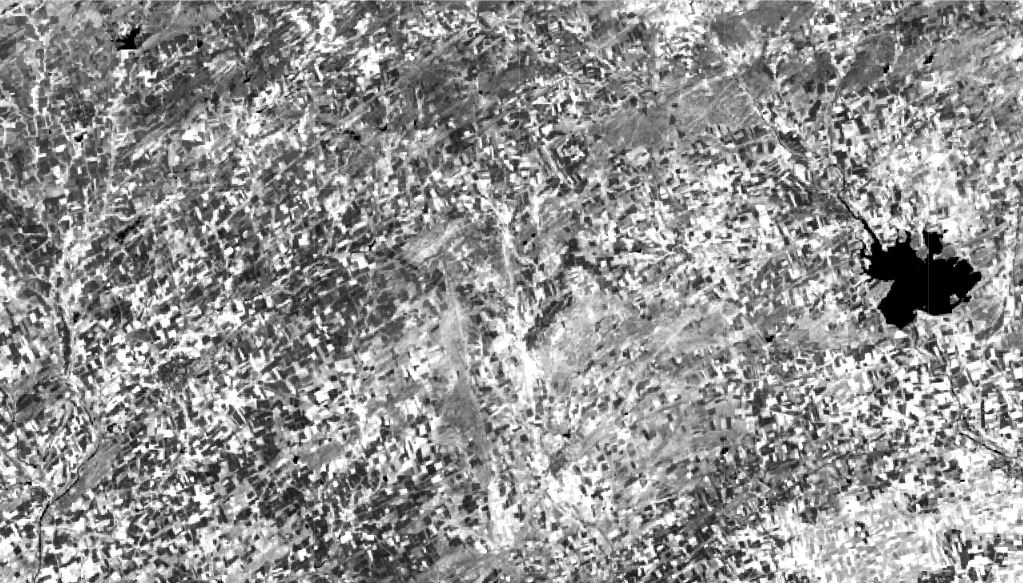
Week 45 (2022-04-14): Luecke Signature Timelapse
Perhaps more historical oddity than art this week, but here is a timelapse of the “largest signature in the world,” just north of Smithville, Texas. It’s about 1km x 4km and has been around since the late 90s.
More info: https://www.atlasobscura.com/places/giant-luecke-signature
I couldn’t resist making a psychedelic one using NDVI, the green band, and NDBI though!
Week 44 (2022-04-07): DSMP-VIIRS Harmonization
Nothing fancy this week. Just messing around with @Zhou_ISU et al.’s 1992-2020 DSMP-VIIRS nightlights harmonization (on a log scale) along with a changing color palette.
Definitely recommend checking out the dataset: https://www.nature.com/articles/s41597-020-0510-y
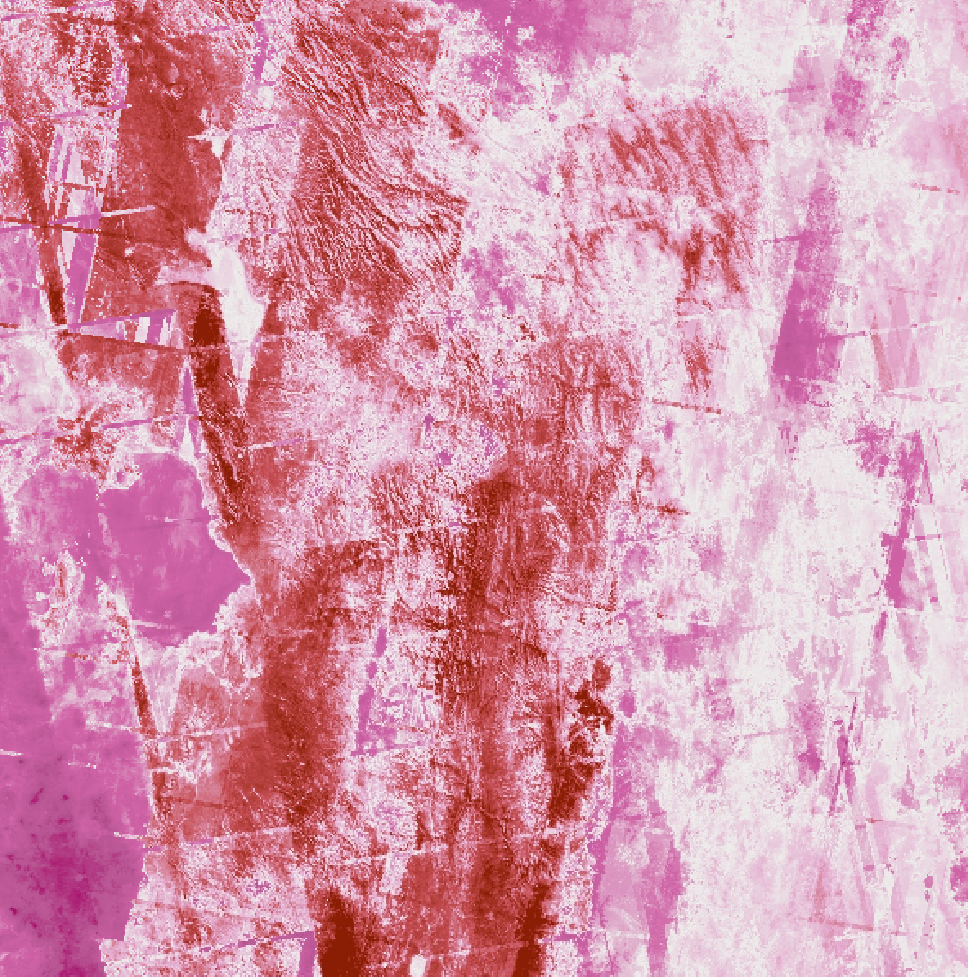
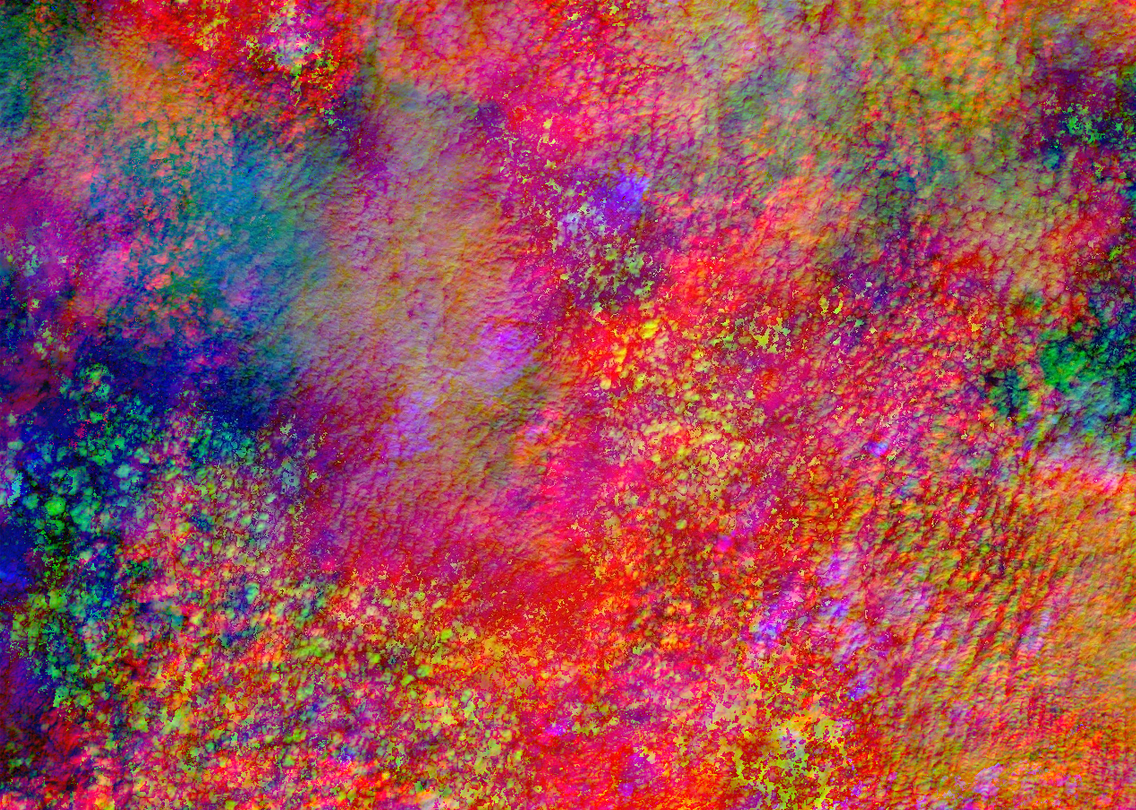
Week 43 (2022-03-31): PRISMA Principal Component Analysis
Back after missing a week due to Atlanta Academy. Here is the @ASI_spazio’s #hyperspectral PRISMA again, this time broken down using PCA (a first for me) and then combining those principal components (including the not-so-principal ones) in various ways.
Week 42 (2022-03-17): PRISMA Bandlapse
Messing around with #hyperspectral imagery for the first time. This is an image of Midongy Du Sud National Park in Madagascar from @ASI_spazio’s PRISMA satellite, iterating through various false color combos of its ~240 VNIR & SWIR bands.
Week 41 (2022-03-10): GOES Gems
A day late, sorry! I may have fallen in love with @NOAASatellites #GOES imagery. At some point I will diversify my data sources again, but in the meantime here are some false color infrared composites from #GOES17 and #GOES18!
Week 40 (2022-03-03): GOES Fire Timelapse

Yesterday @NOAASatellites #GOEST successfully launched. Soon it will magically become GOES-18. Today’s piece is inspired the GOES-R Fire/Hot Spot dataset in #GEE. These circles are wildfires from late June 2020, scaled and colored based on temperature
Week 39 (2022-02-24): GOES NDVI Timelapse
In anticipation of the imminent launch of #GOEST, I am using @NOAASatellites’ #GOES17 for the first time! This is a timelapse of my birthday in an NDVI-centric false color. Really shows the importance of accounting for lighting conditions in #EO!
Week 38 (2022-02-17): Wuhan Mean Anomalies
A pair of images that combine the mean anomalies of nightlights, NDVI, NDBI, and blue band in different ways (ref period is 2015-16, obs period is 2017-2019). Data from @USGSLandsat 8 & VIIRS. Area is just south of Wuhan.
Week 37 (2022-02-10): Macacu Branches
A look at the Área De Proteção Ambiental Da Bacia Do Rio Macacu of the state of Rio de Janeiro in a few different ways, including SRTM elevation, #Sentinel 1 SAR, and @USGSLandsat 8 NDVI.
Week 36 (2022-02-03): SAR Colors
Three visually distinct pieces made using very similar processes. These were all made using @ESA_EO #Sentinel 1 SAR to identify ships, then processing the results in various ways.
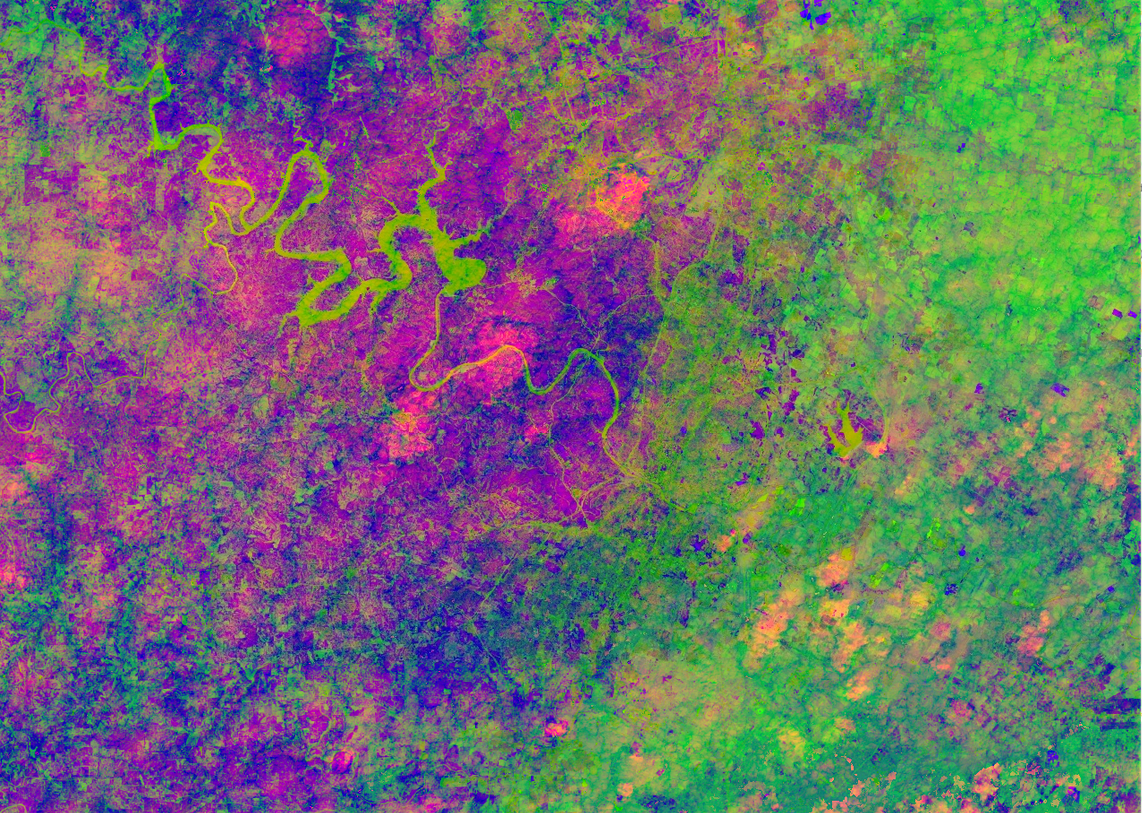
Week 35 (2022-01-27): Mapbiomas Changes
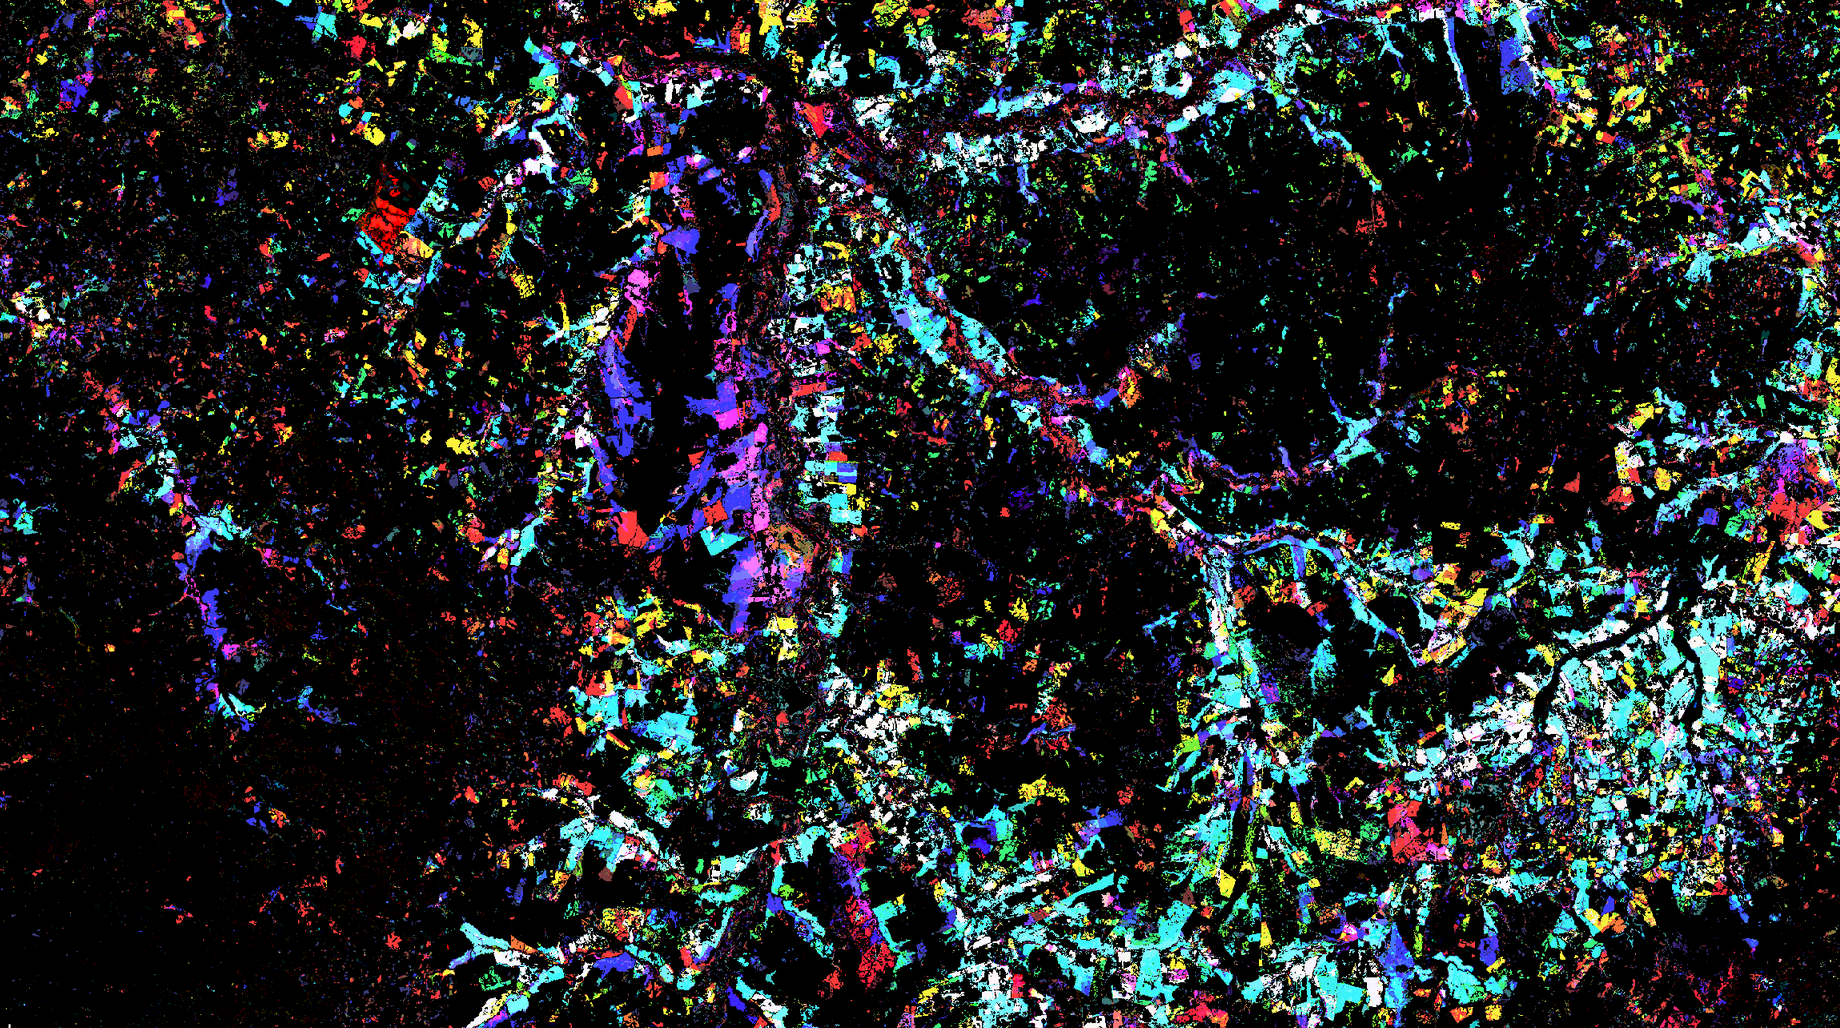
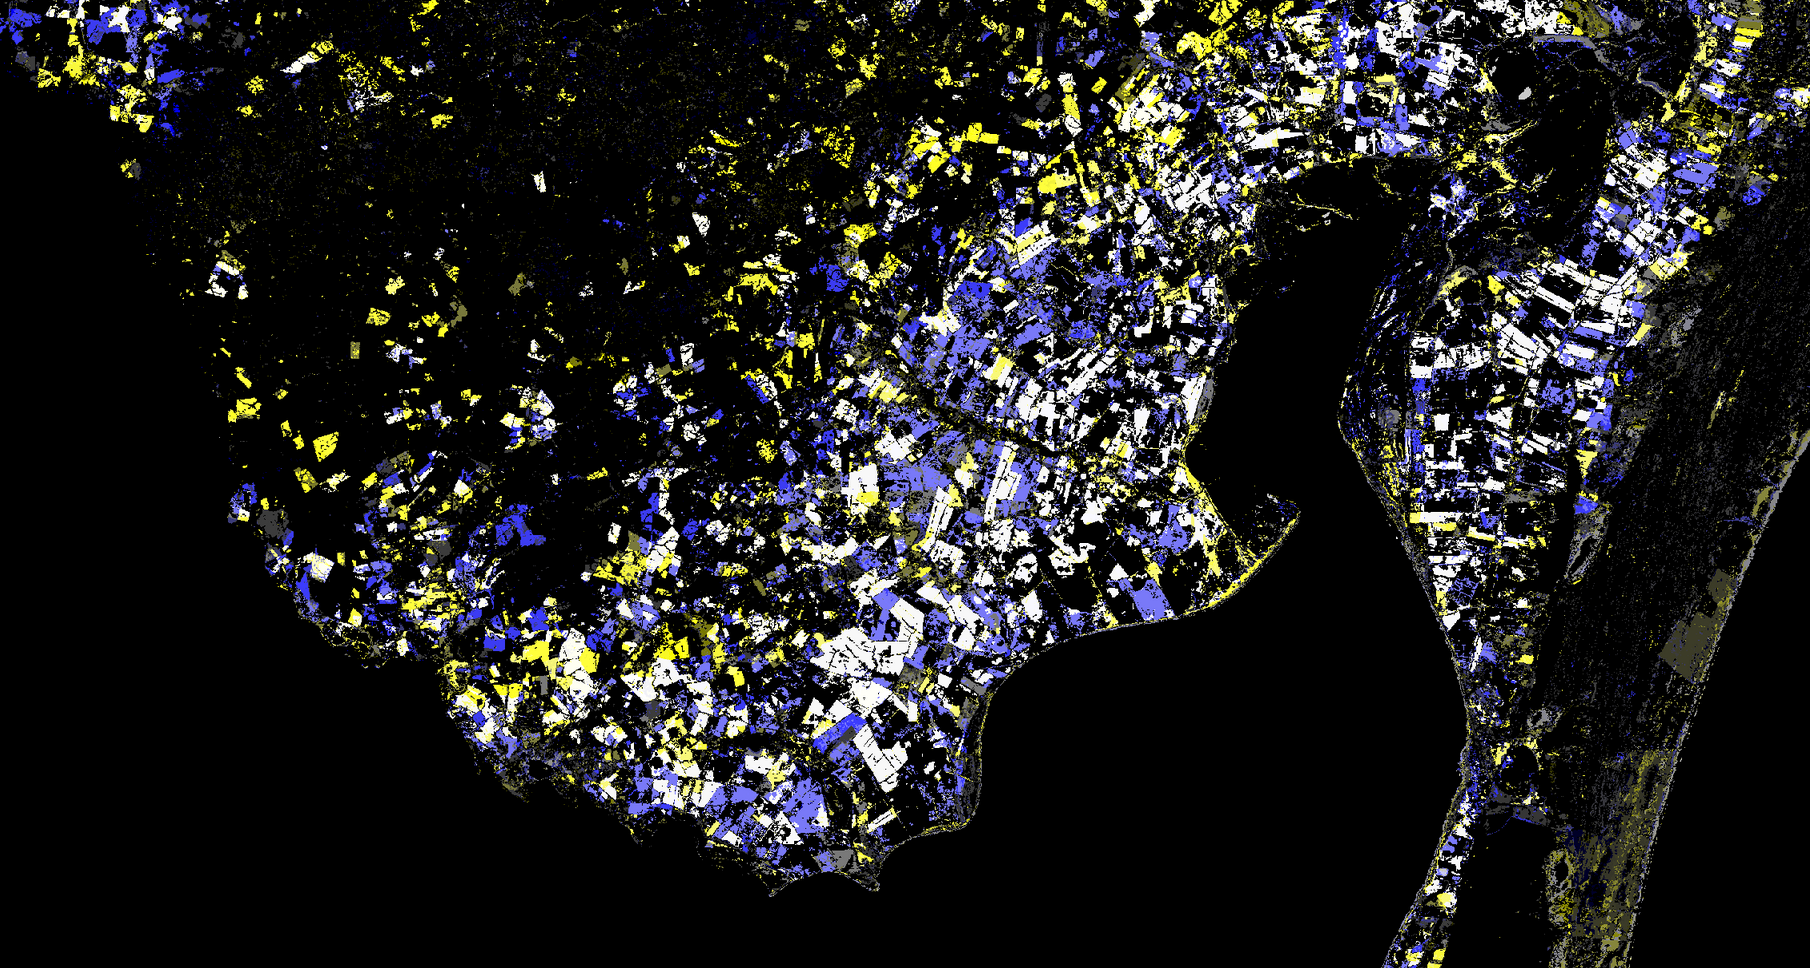
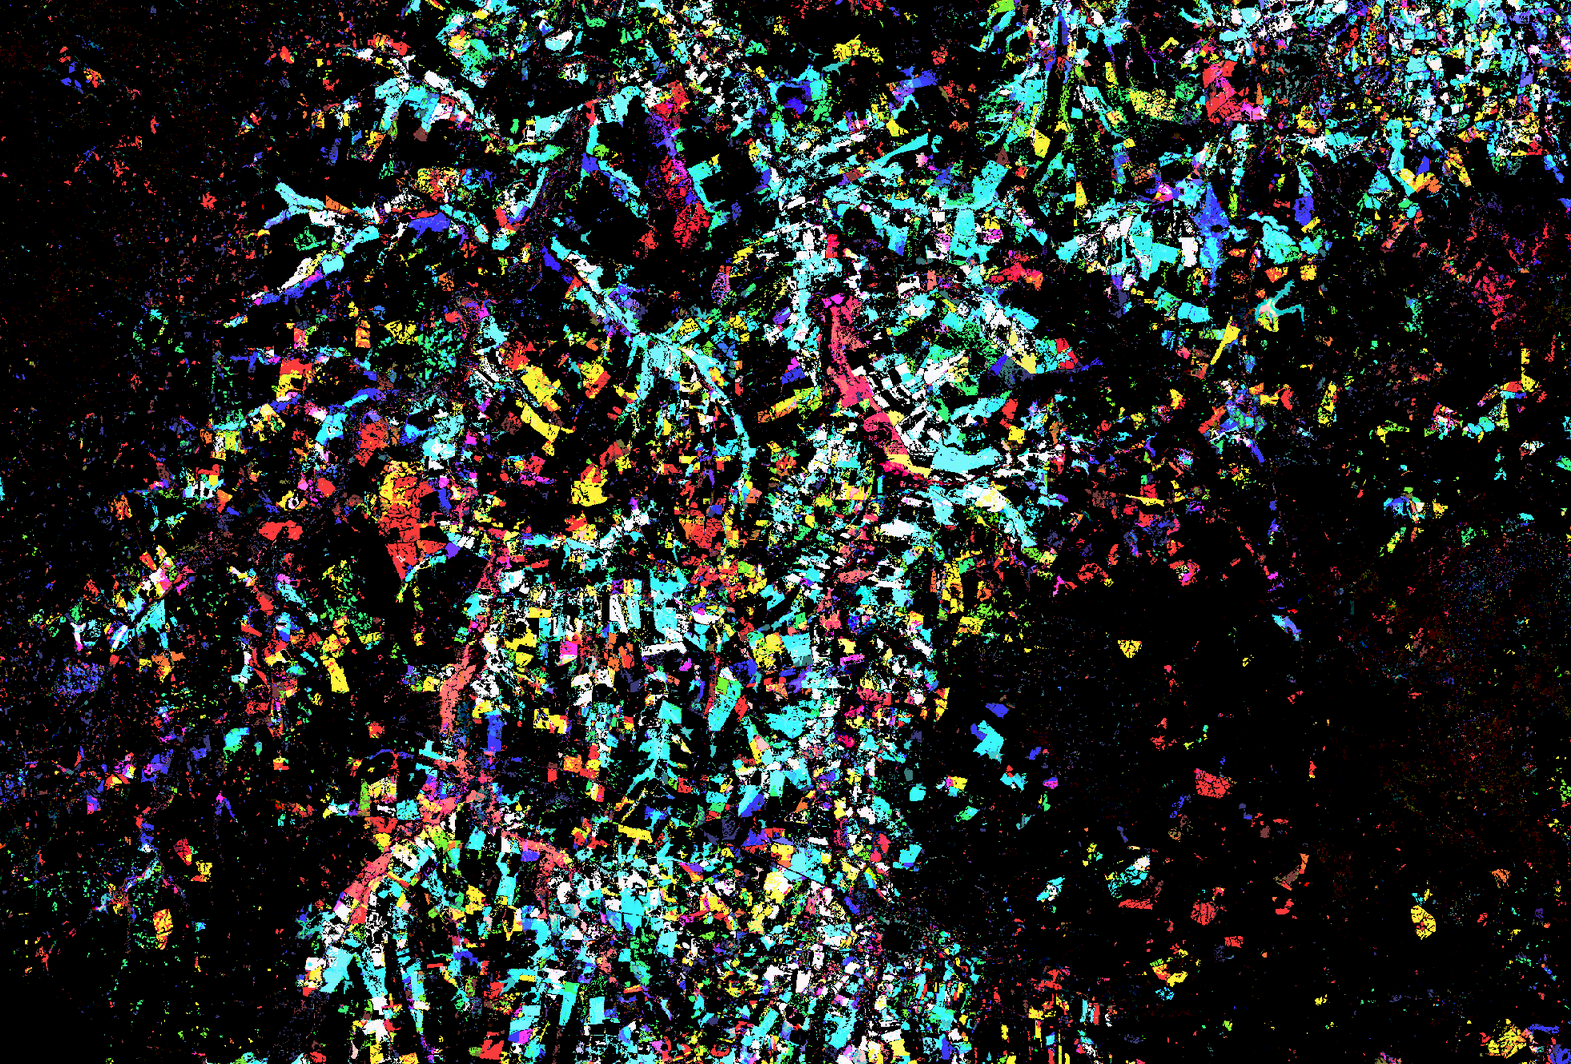
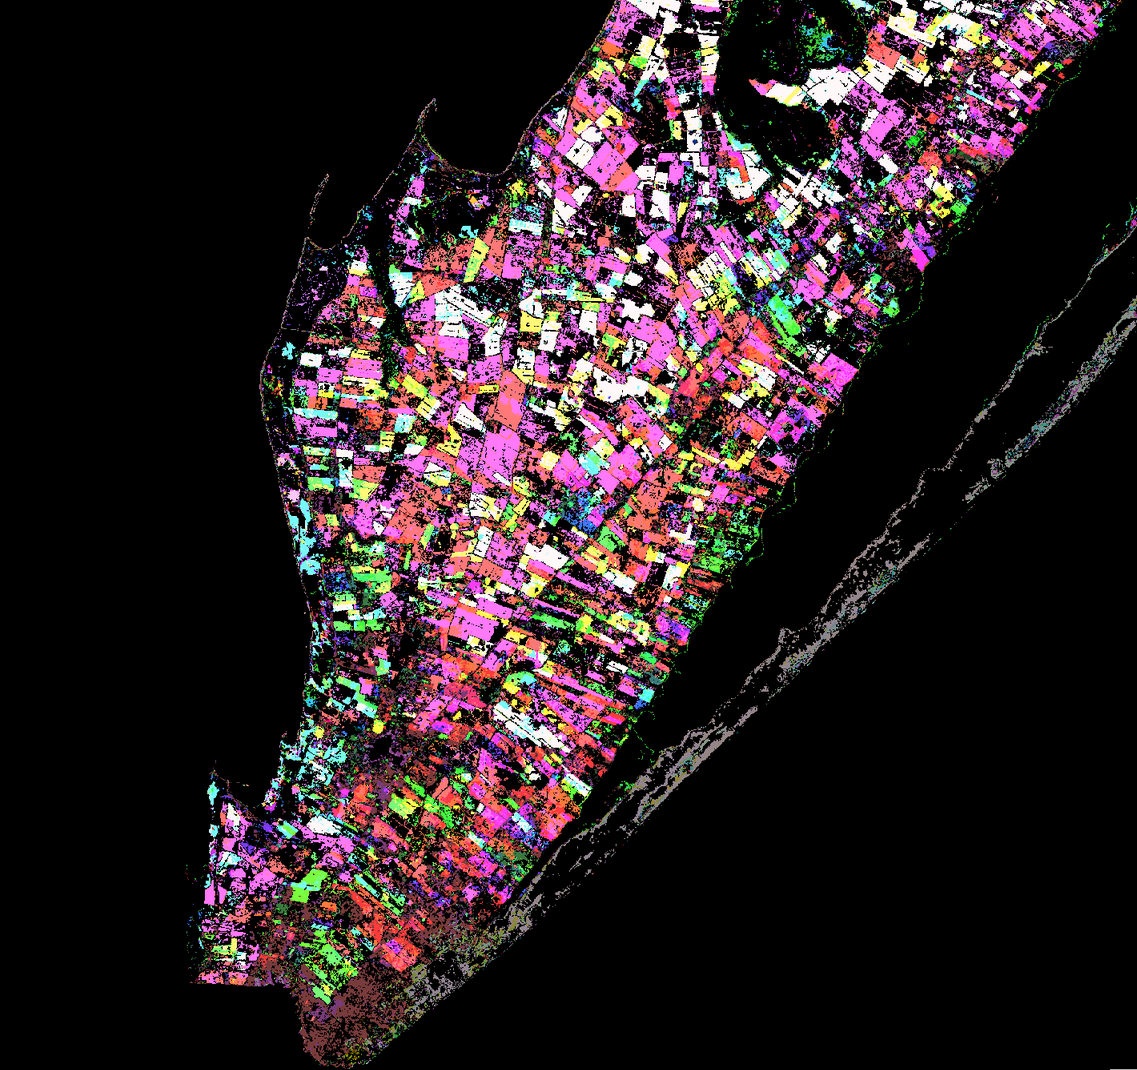
These are some visualizations of land cover change in different parts of Brazil over the period 1985 - 2020, using the wonderful @mapbiomas dataset (which is directly available on #GoogleEarthEngine). Definitely recommend checking it out if you work in that part of the world.
Week 34 (2022-01-13): Nightlights Green
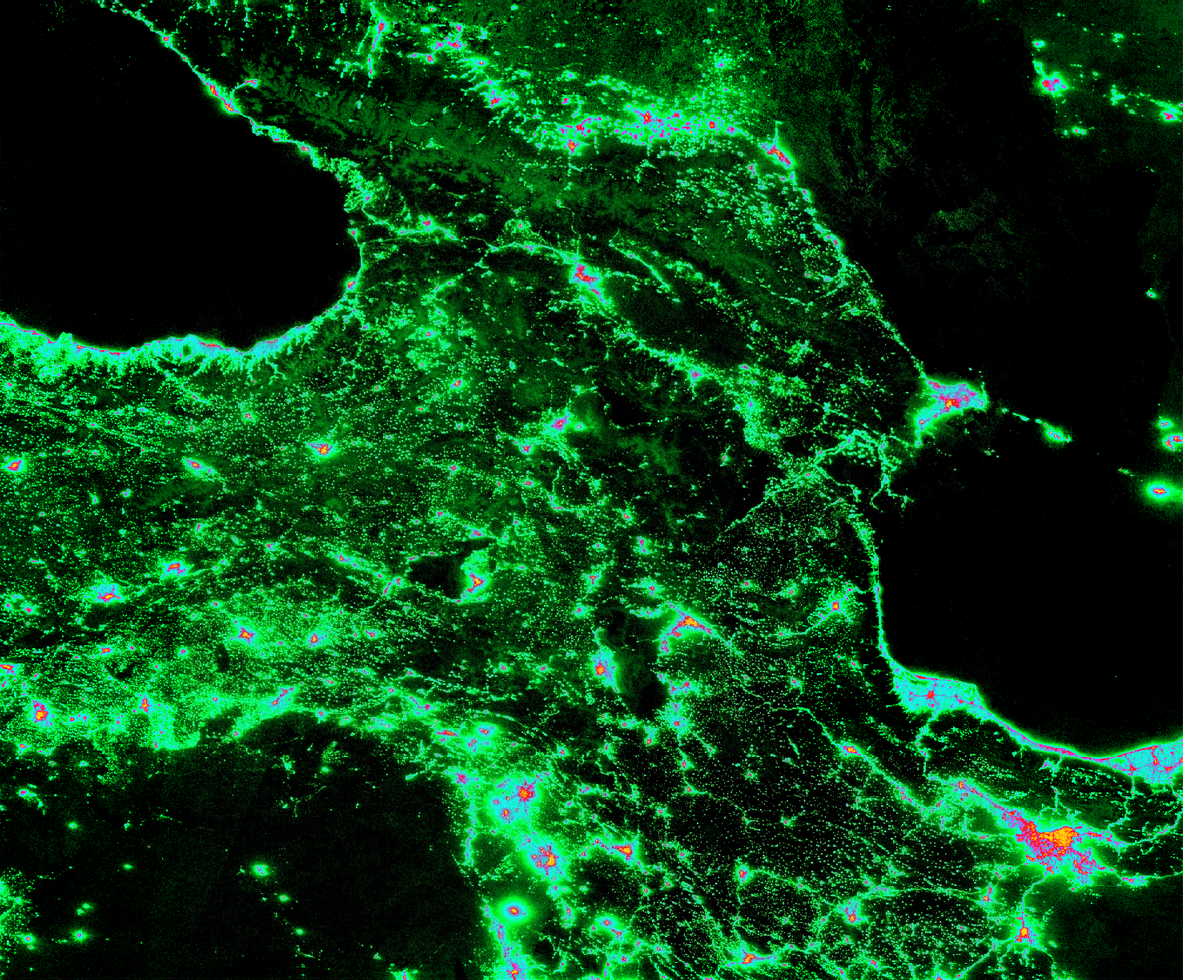
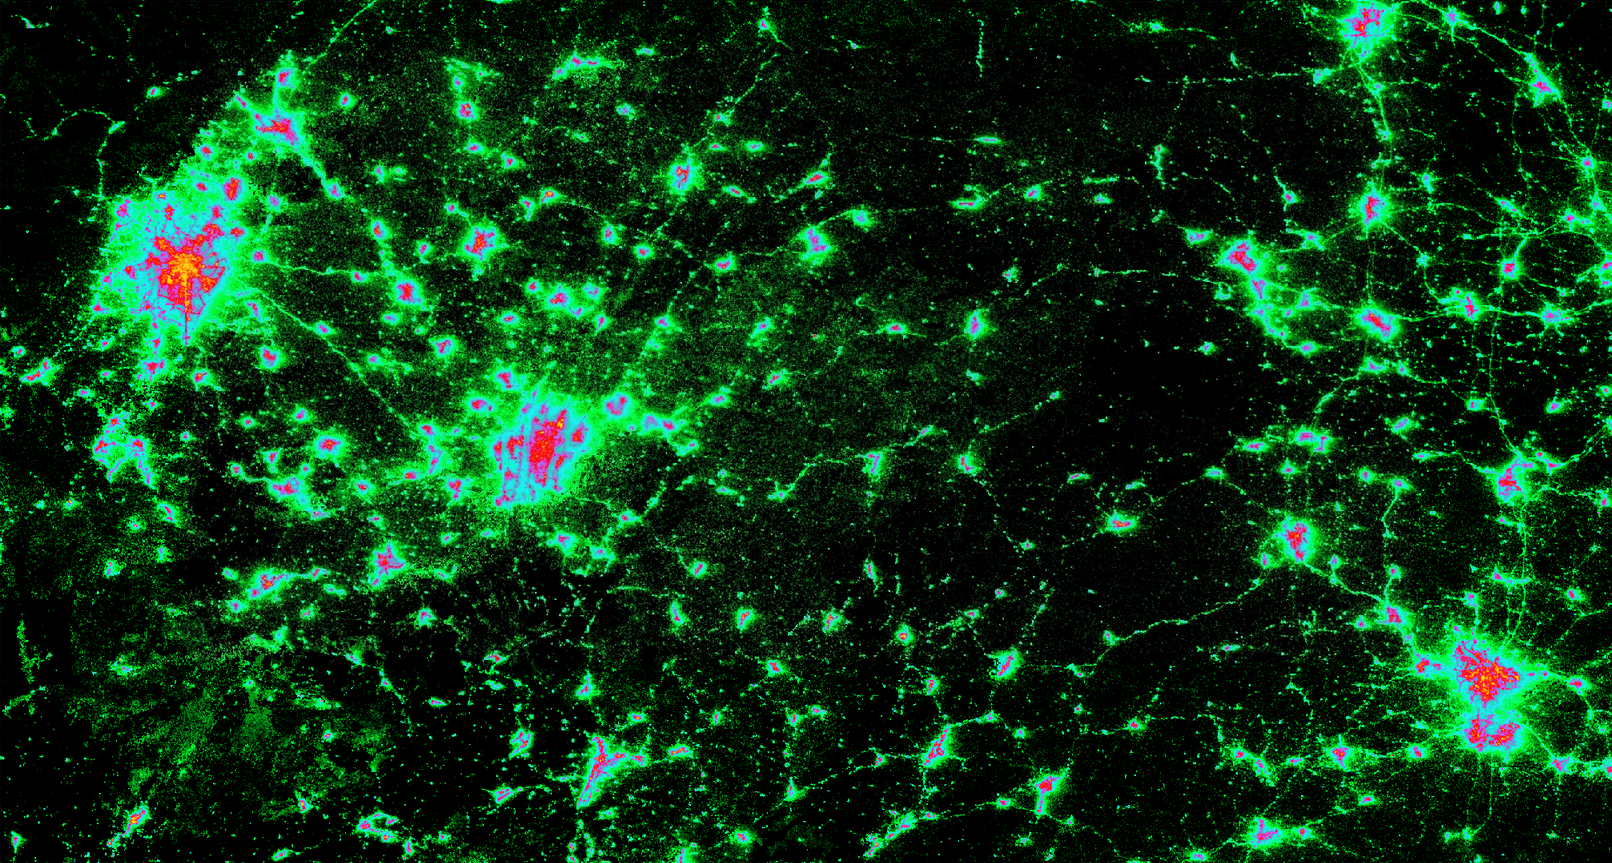
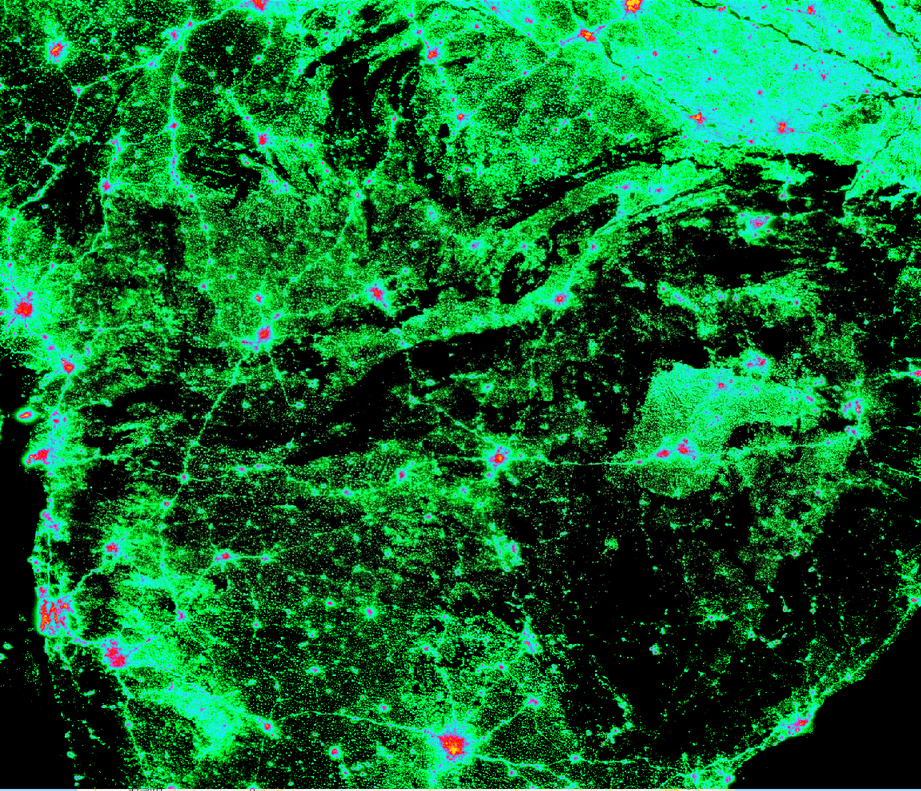
I tried out a few things this week but ultimately settled on something rather simple: log-scale of VIIRS nightlights (to bring out the detail) + a color palette that I like. These are from a few different places around the world, some more obvious than others.
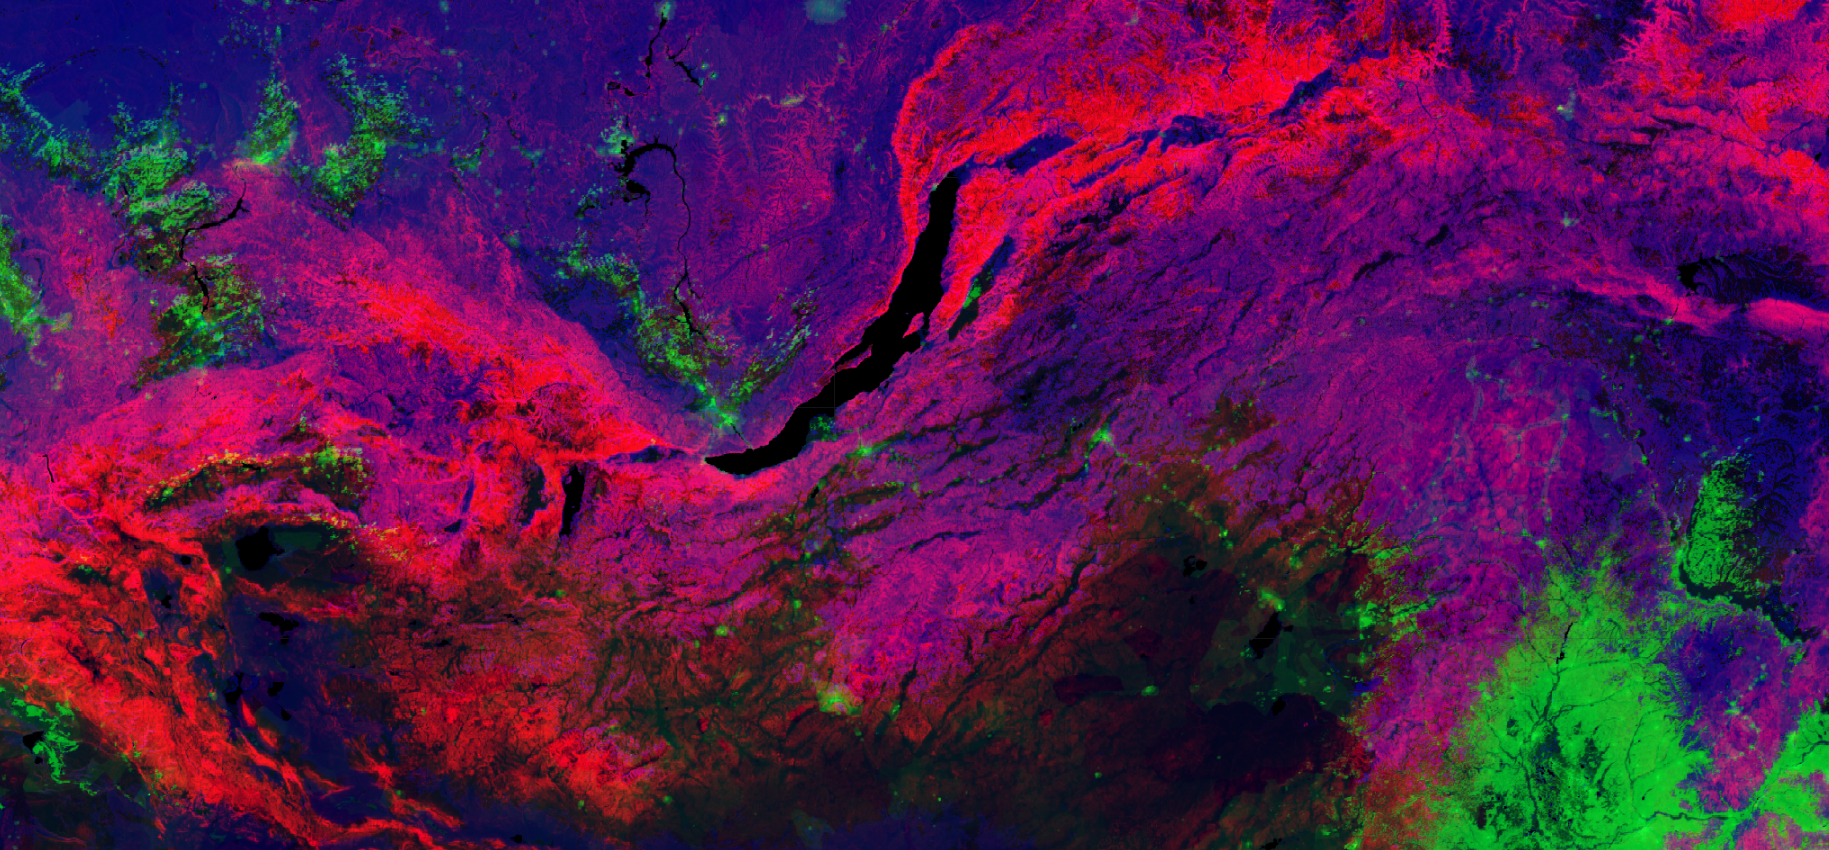
Week 33 (2022-01-06): Austin Indices & Clouds
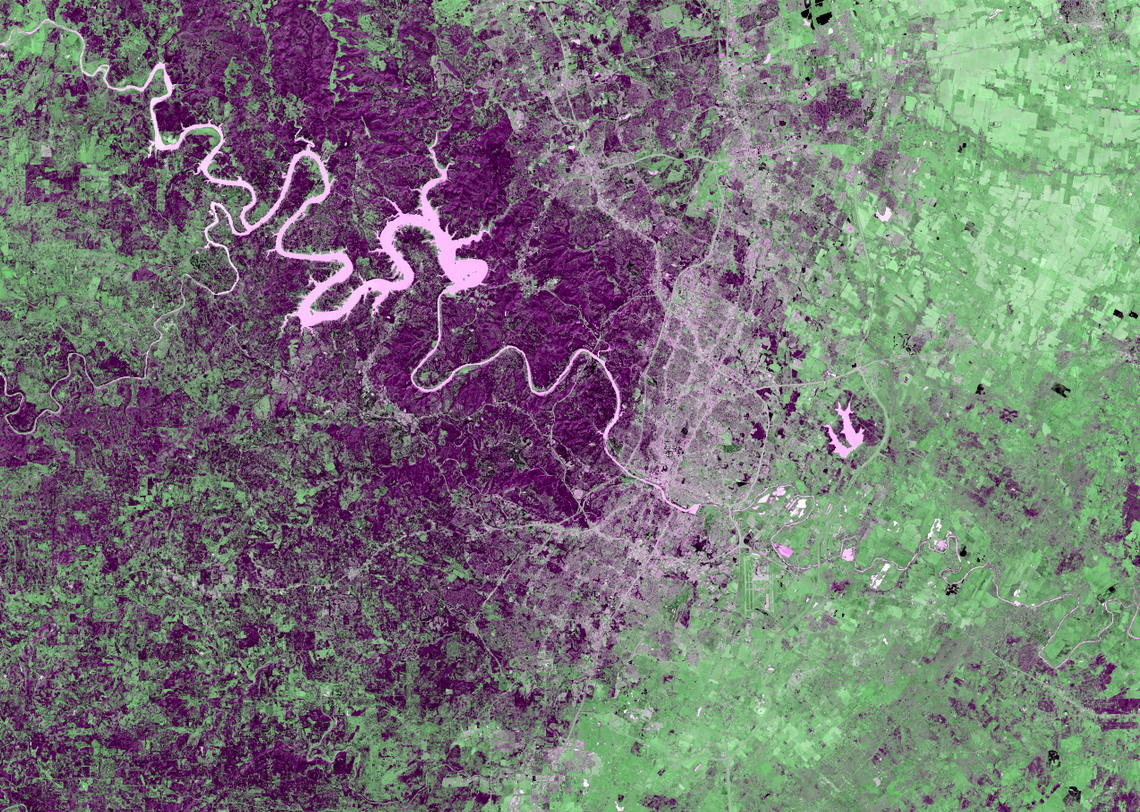
Messing around with indices (vegetation, water, built up) and clouds in the area of my hometown, Austin, using @USGSLandsat 8.
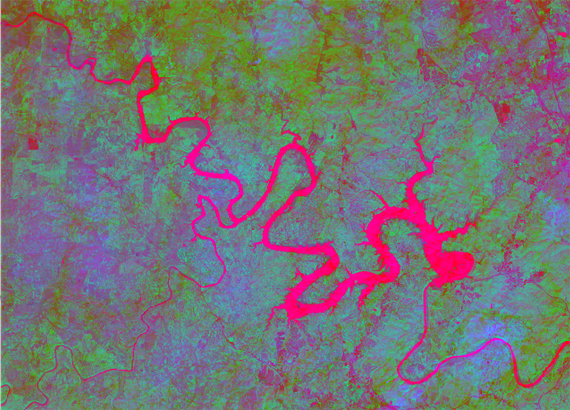
Lake Travis looks like a long-tongued dragon serpent, don’t it? I spent a lot of time in the southeast corner of it as a child, but never really had a concept of its shape.
Week 32 (2021-12-30): Satellite Tracks
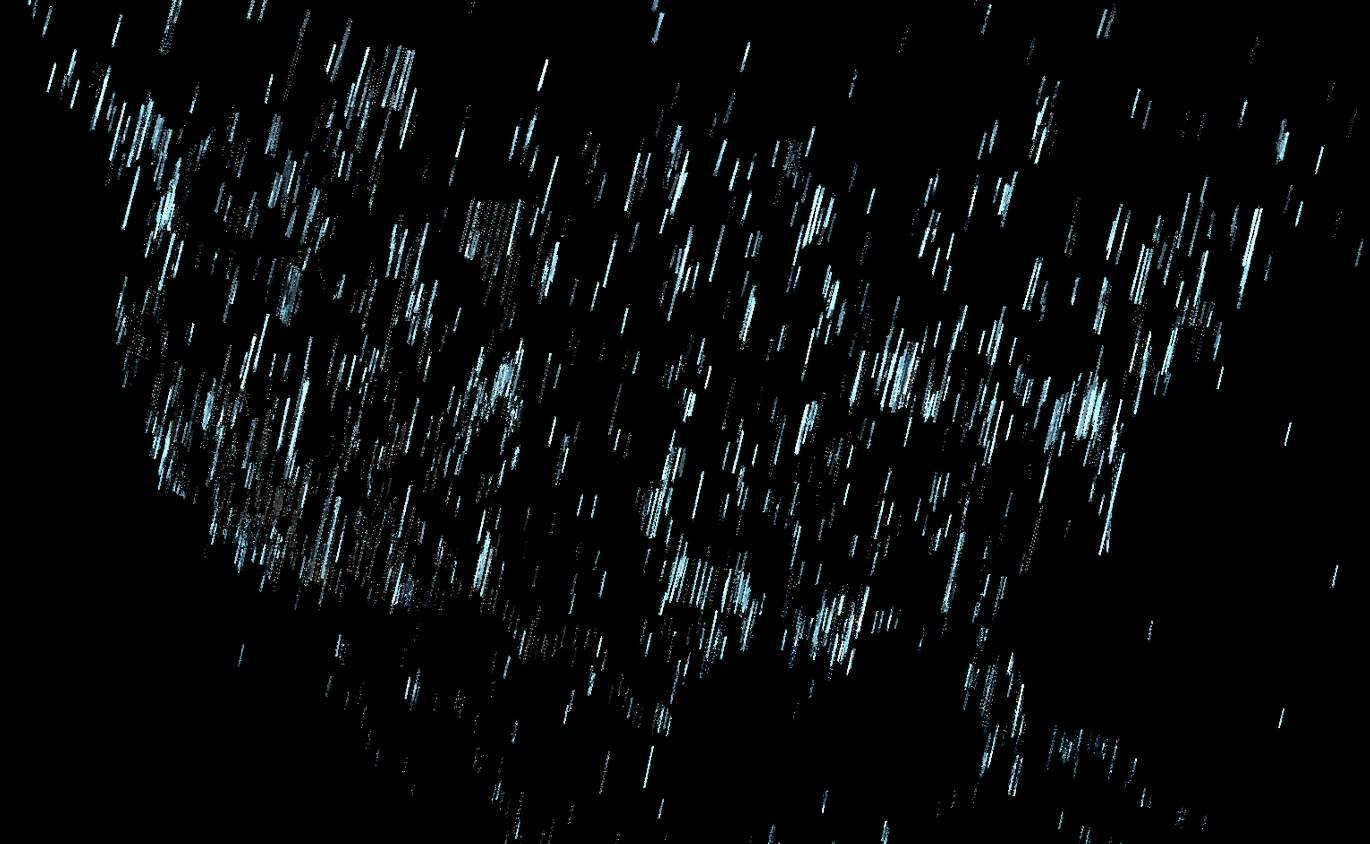
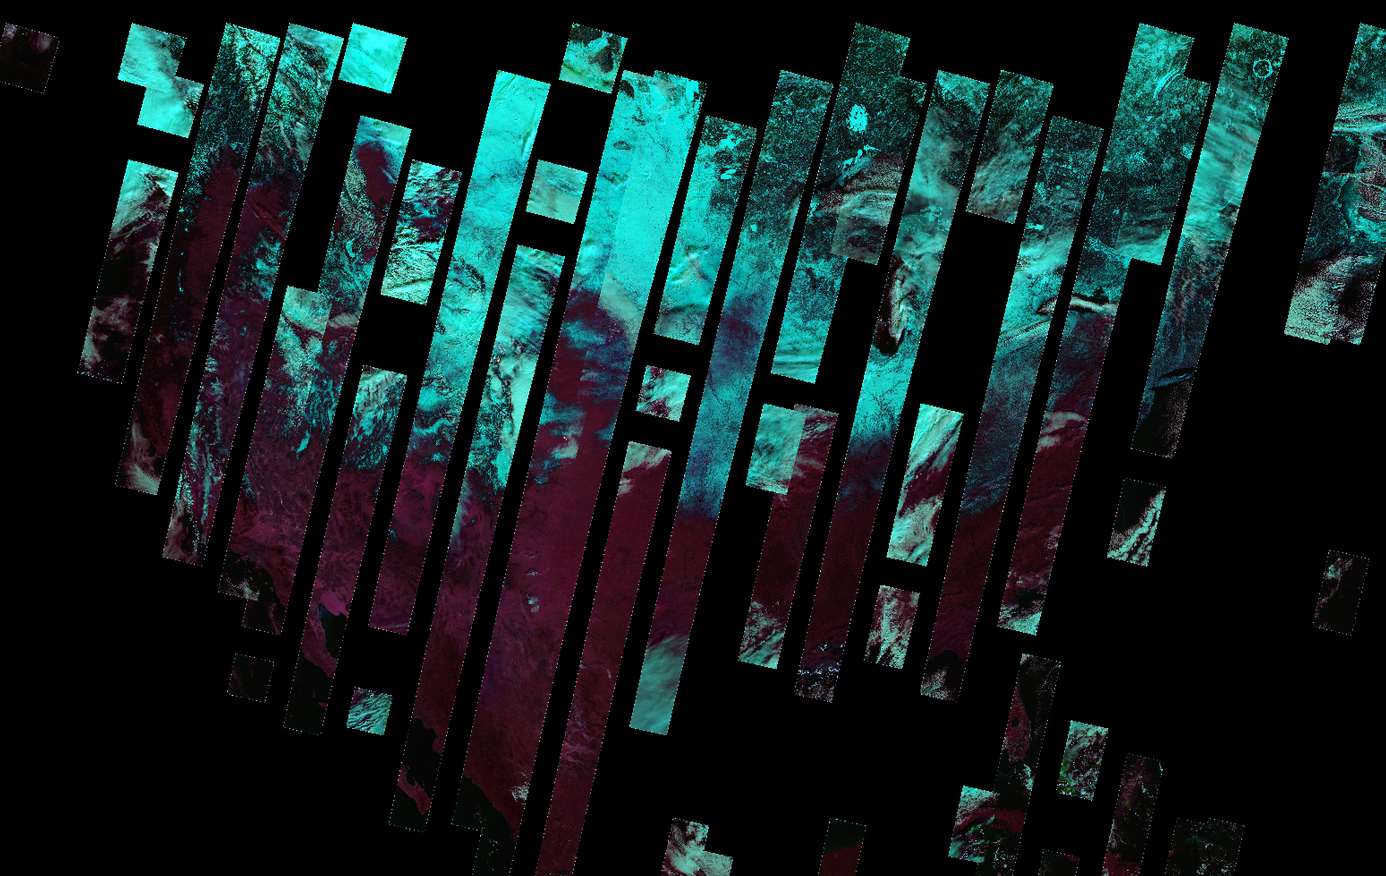
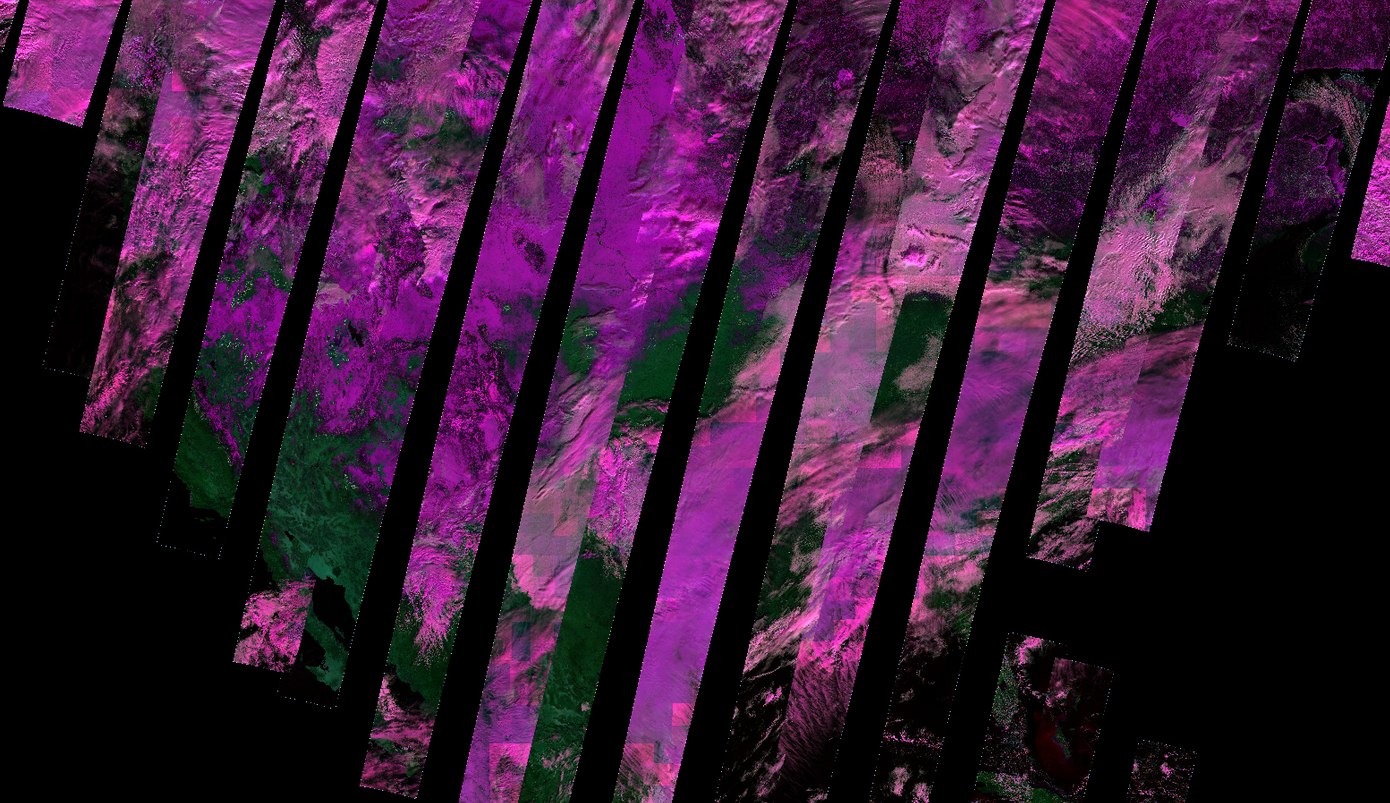
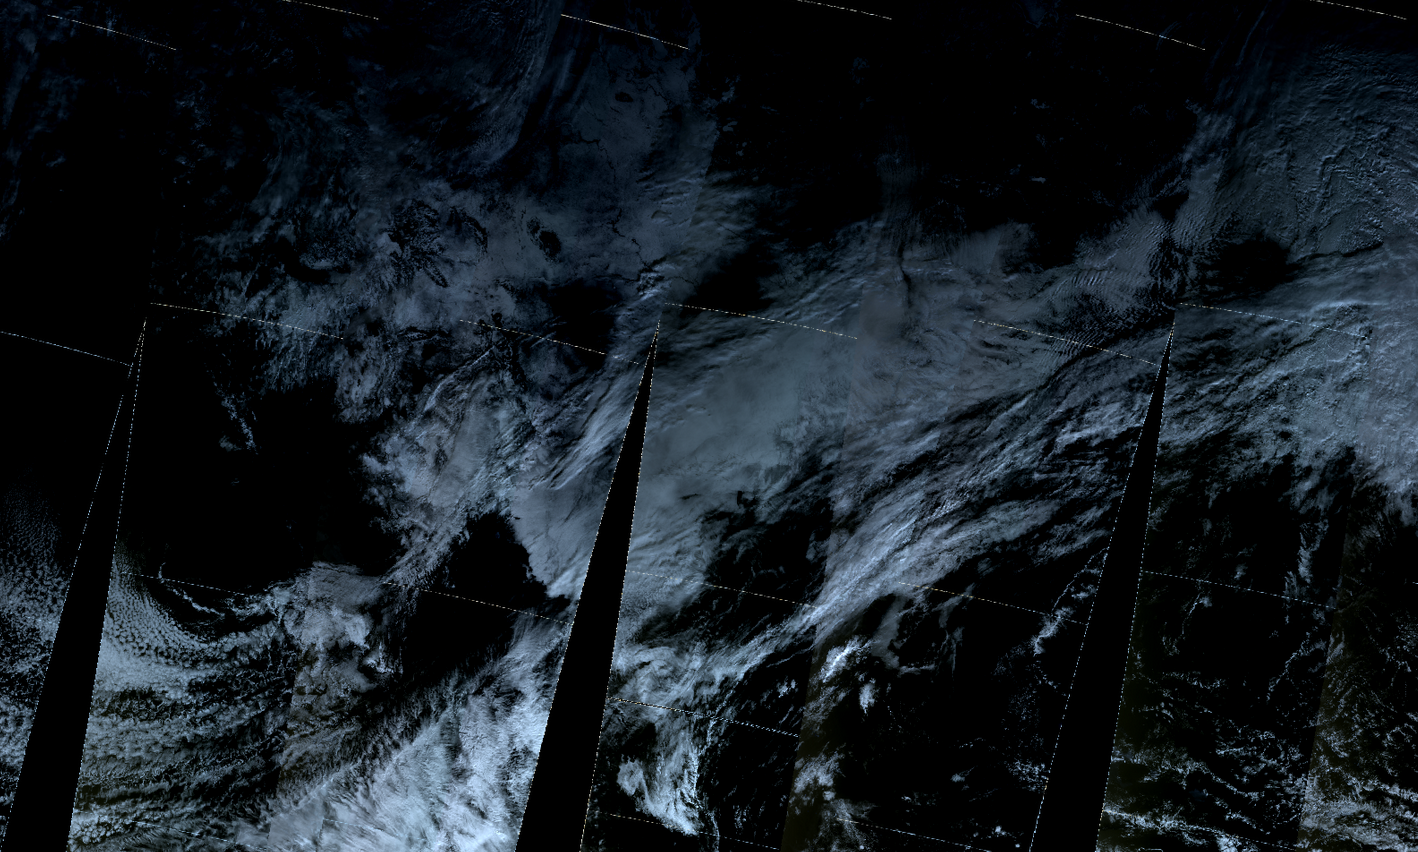

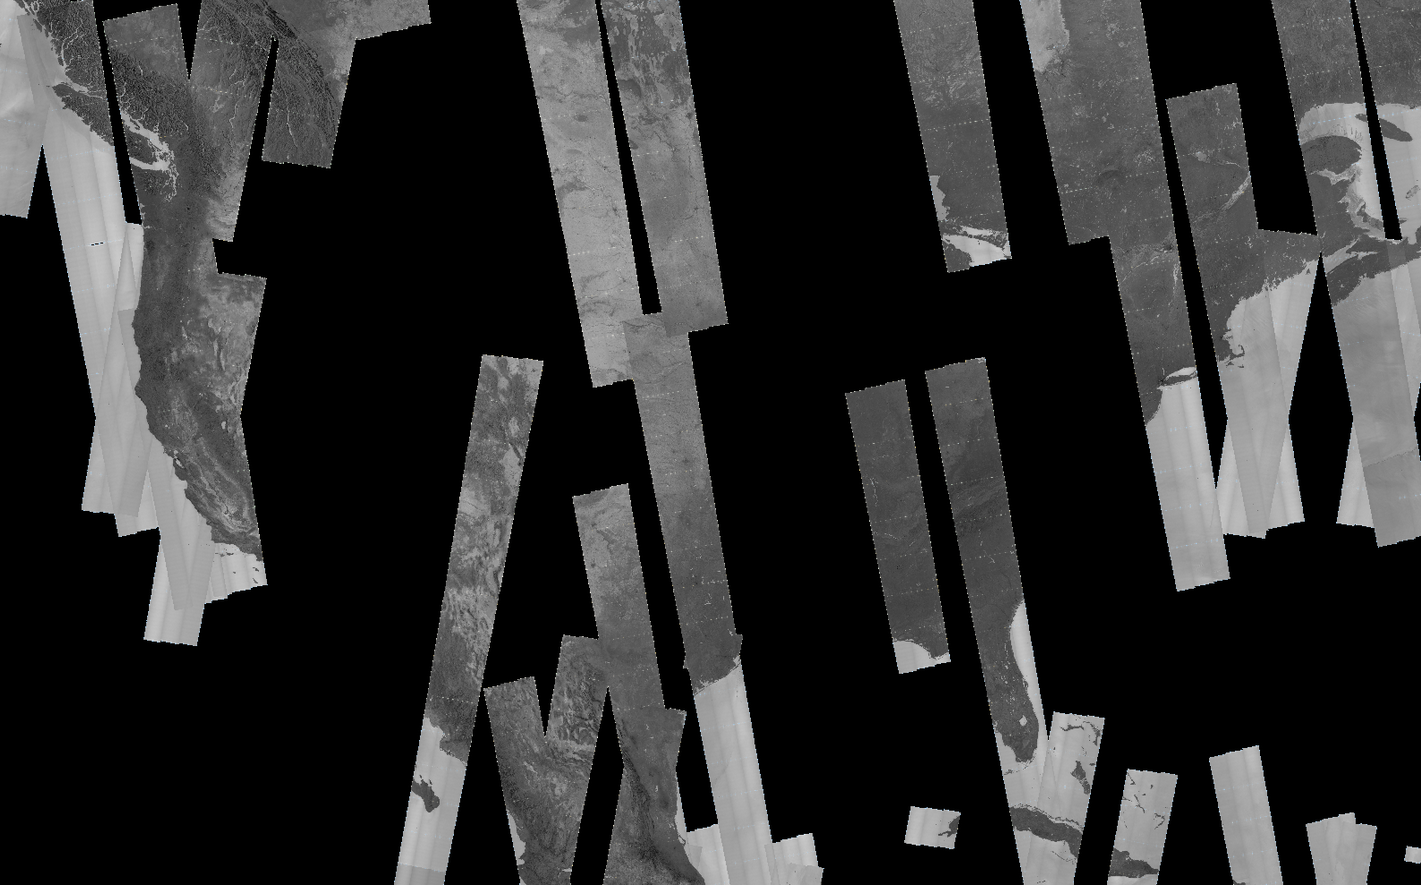
Happy New Years Week! When scientists use EO images, we often build seamless mosaics that blend images & hide boundaries. These pieces do the opposite, highlighting what different satellite tracks look like. Can you guess what satellite made each image?
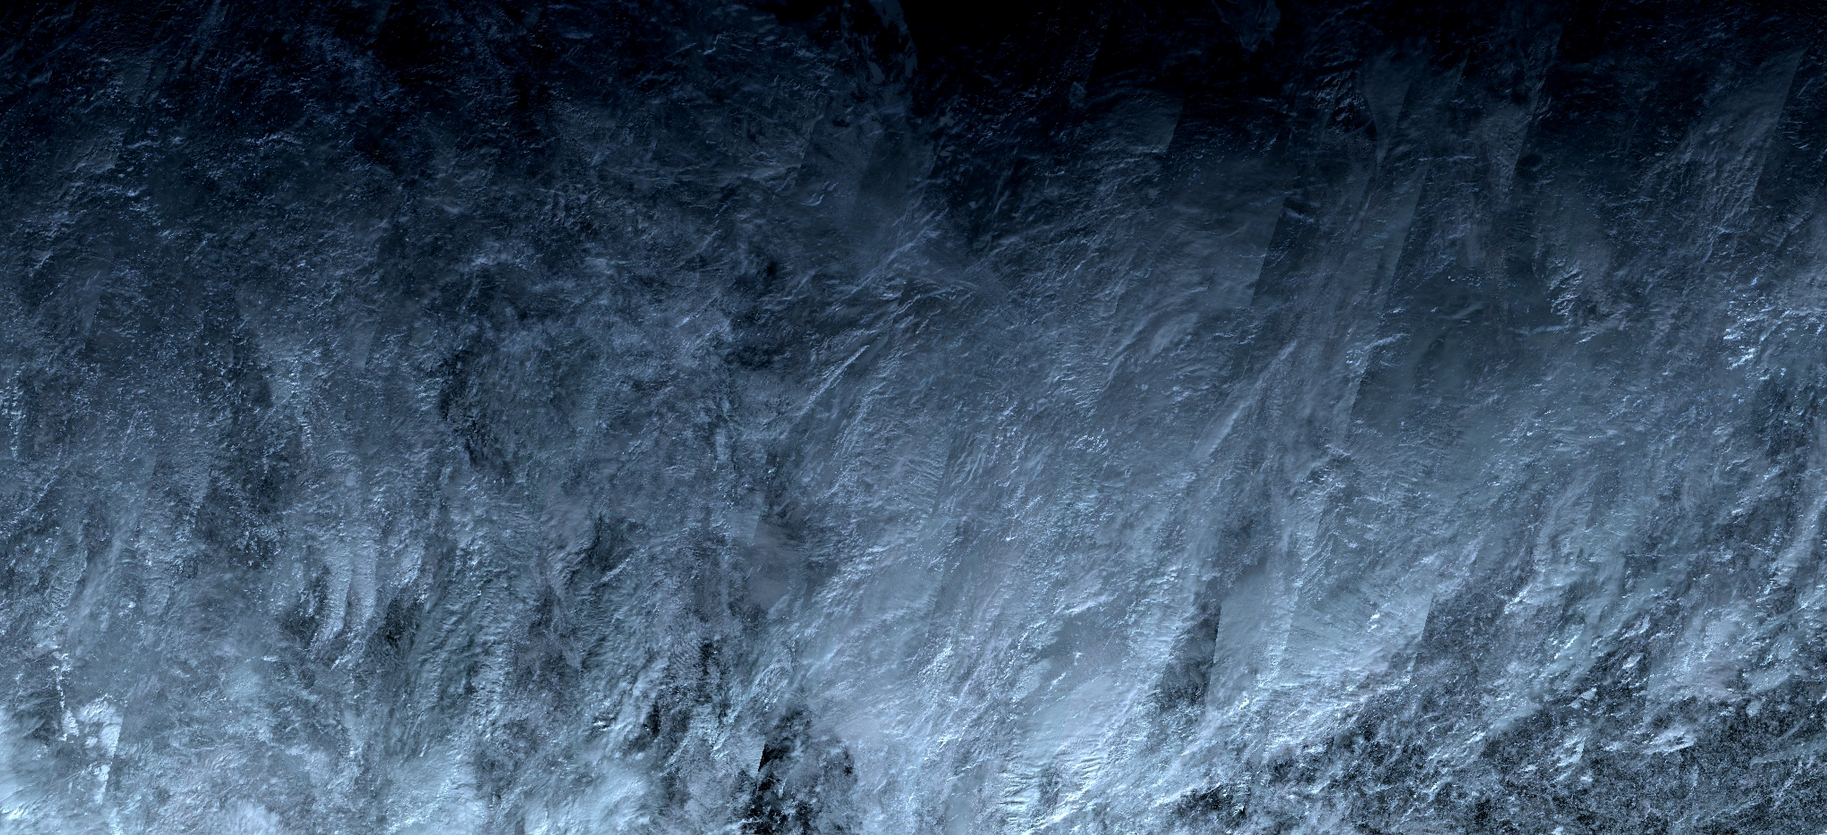
Also, a few weeks back, I shared by desktop image. Well that’s now my former desktop image as it has been replaced by this Sentinel-3 OLCI mosaic. I just love the texture!
Week 31 (2021-12-23): Neon Christmas Tree
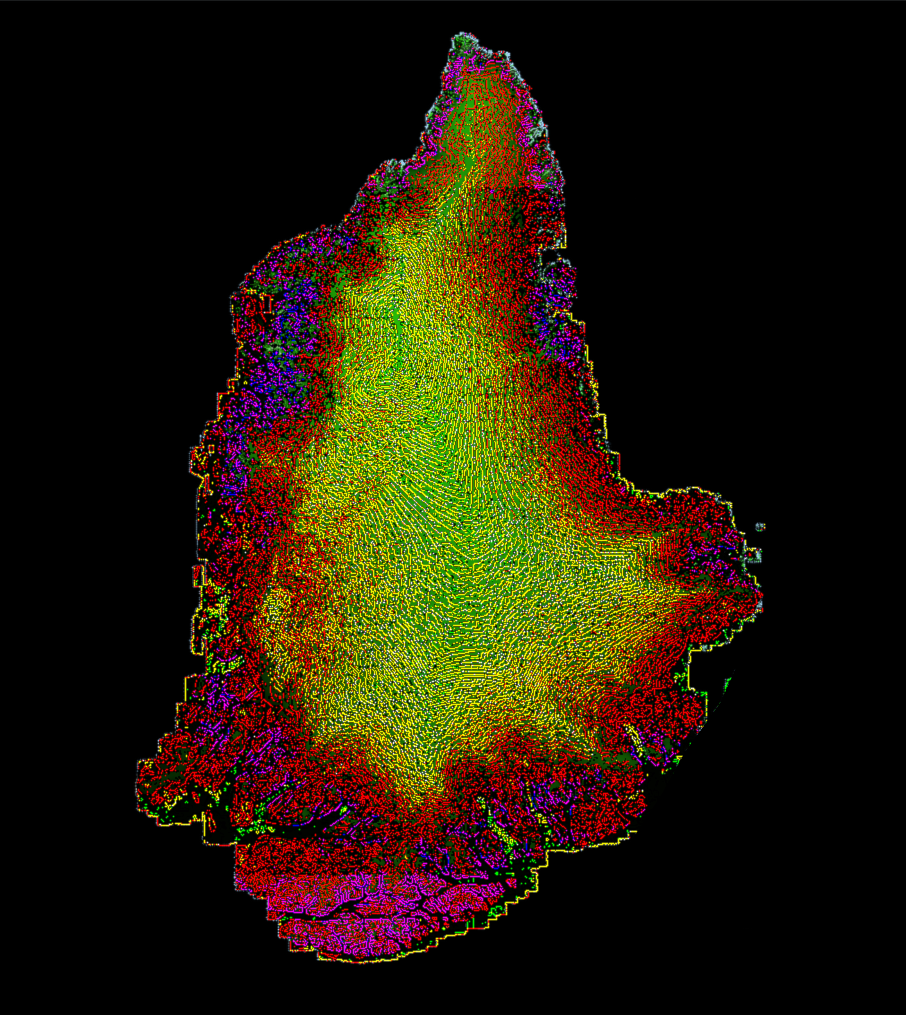
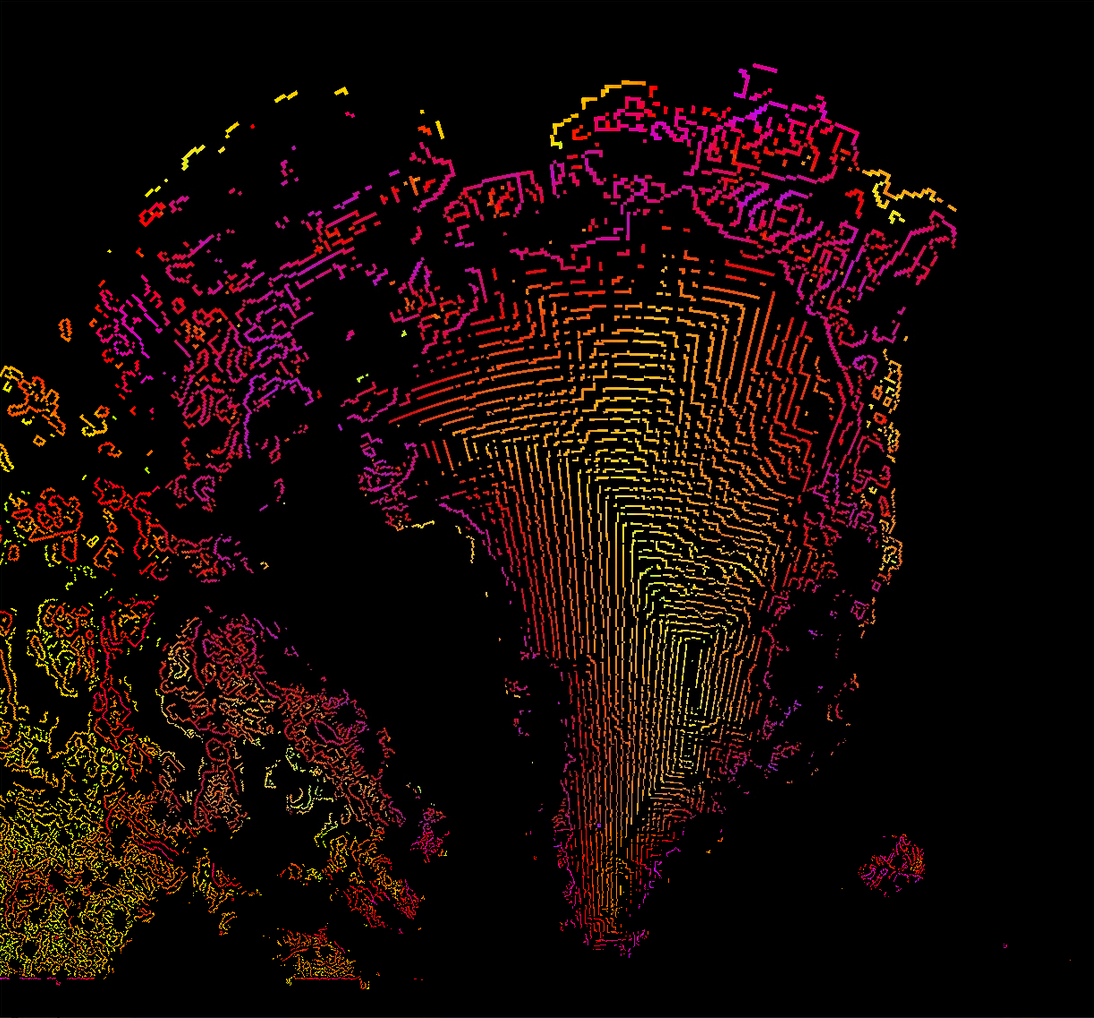
Christmas is only a few days off, so here is a Greenland neon Christmas tree made using @polargeospatial’s ArcticDEM Mosiac plus some edge detection.
Not very tree-like, but I also liked this intermediate image.
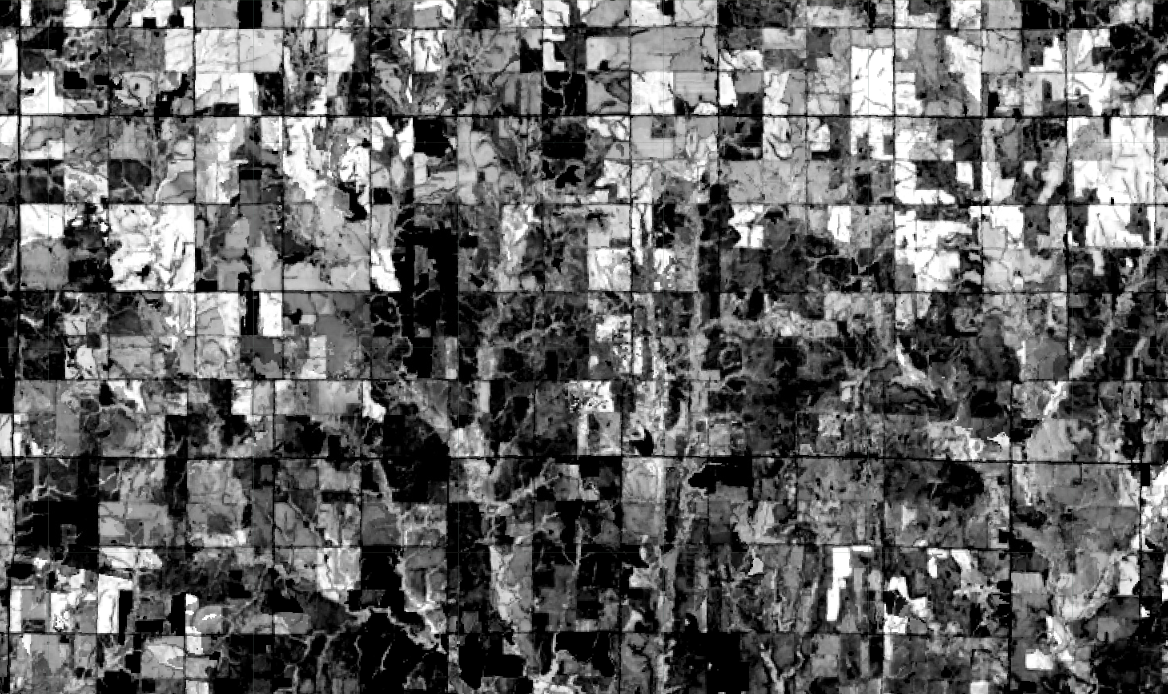
Week 30 (2021-12-09): Oklahoma Old Landsat
Nothing fancy, just liked using @USGSLandsat 1-3 last week, so ran it back. Since they lacked a blue band, I used a blue palette! The blocky parts are real, that’s farmland north of OK City. The other artifacts, well that’s just the old Landsat data acting up.
Week 29 (2021-12-02): Hurricane Tracks Timelapse


Got a pair of timelapse pieces for y’all. Both are representations of the Atlantic hurricane tracks from 1880 to 2018 based on NOAA HURDAT2. Some of them spiraled way off to the north out of frame! #earthengine
Week 28 (2021-11-25): Thanksgiving Finger Turkey
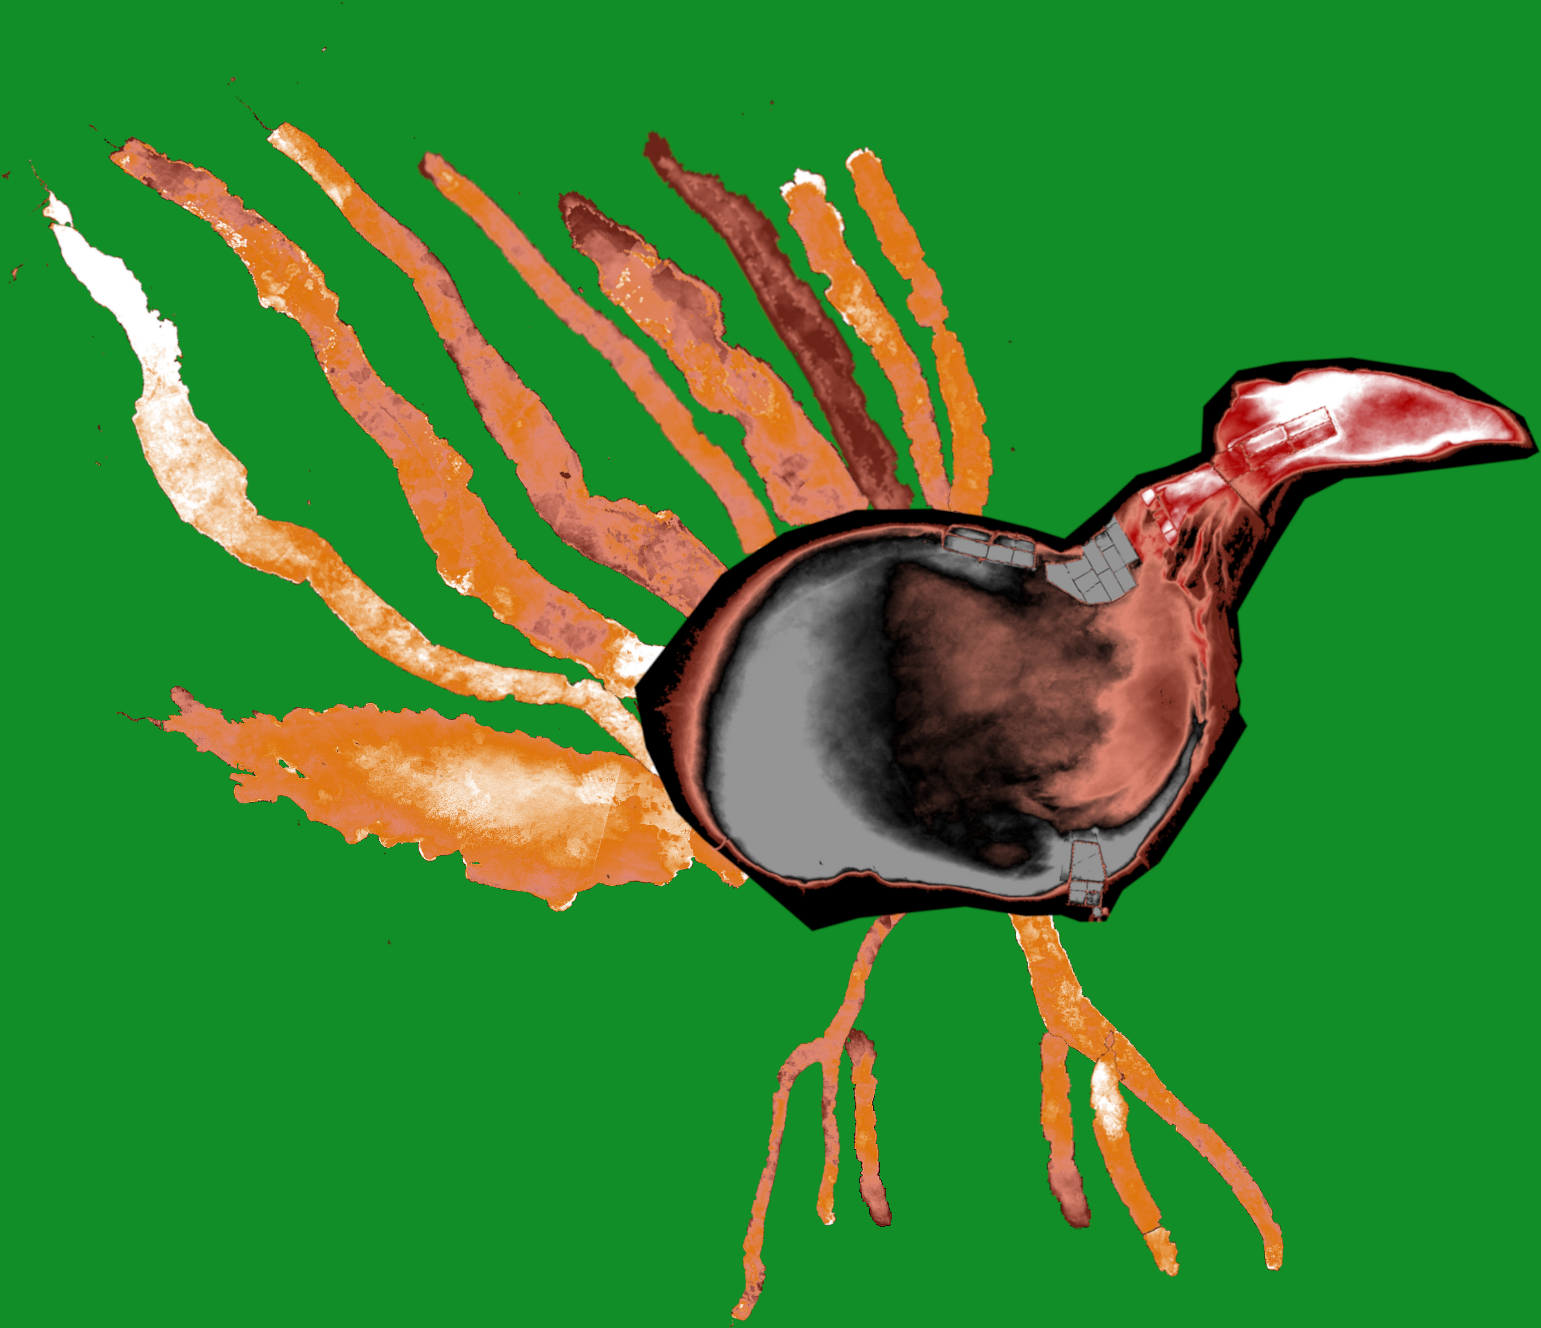
Y’all remember painting hand turkeys as a child? Well I’ve done my best to recreate one in an appropriately jank fashion using the Finger Lakes of NY + Tuz Gölü of Turkey! Colors made by NDWI using @USGSLandsat. Happy Thanksgiving!
Week 27 (2021-11-18): Sacramento Distances
I promise that I will do things other than distance maps at some point. This is the Sacramento area, compositing distance from water (MOD44W), distance from 2000-2020 wildfires (Globfire), & roads (TIGER, brightness based on road type, & a focal mean kernel).
I also like how the road band turned out by itself.
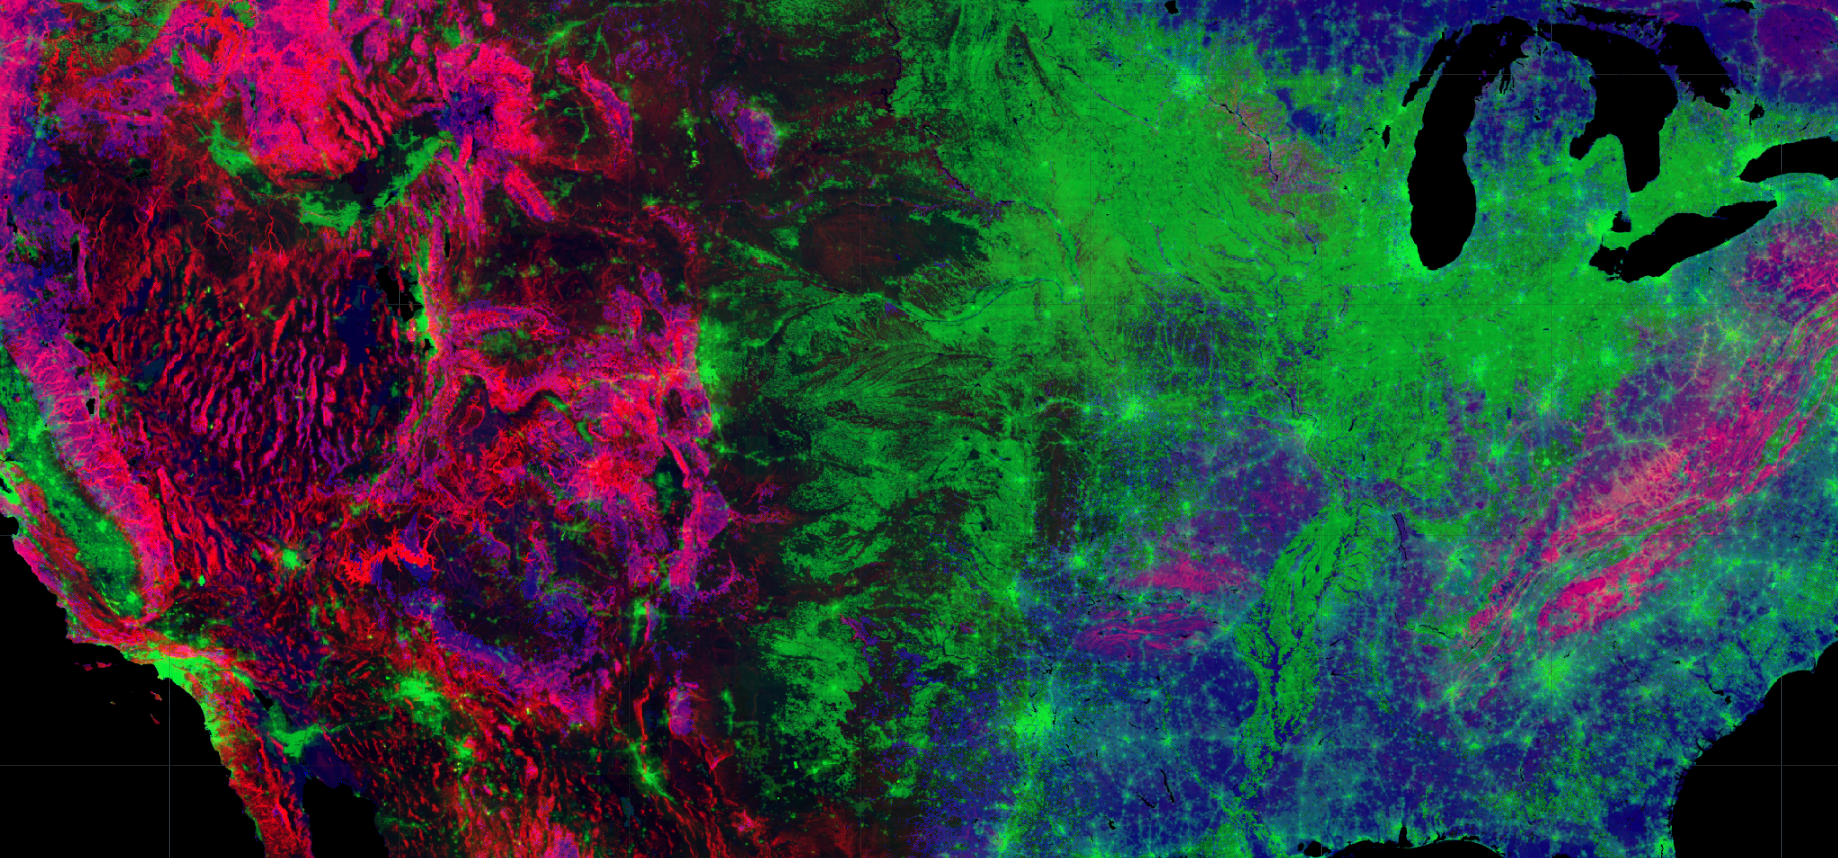
Week 26 (2021-11-11): US Distances
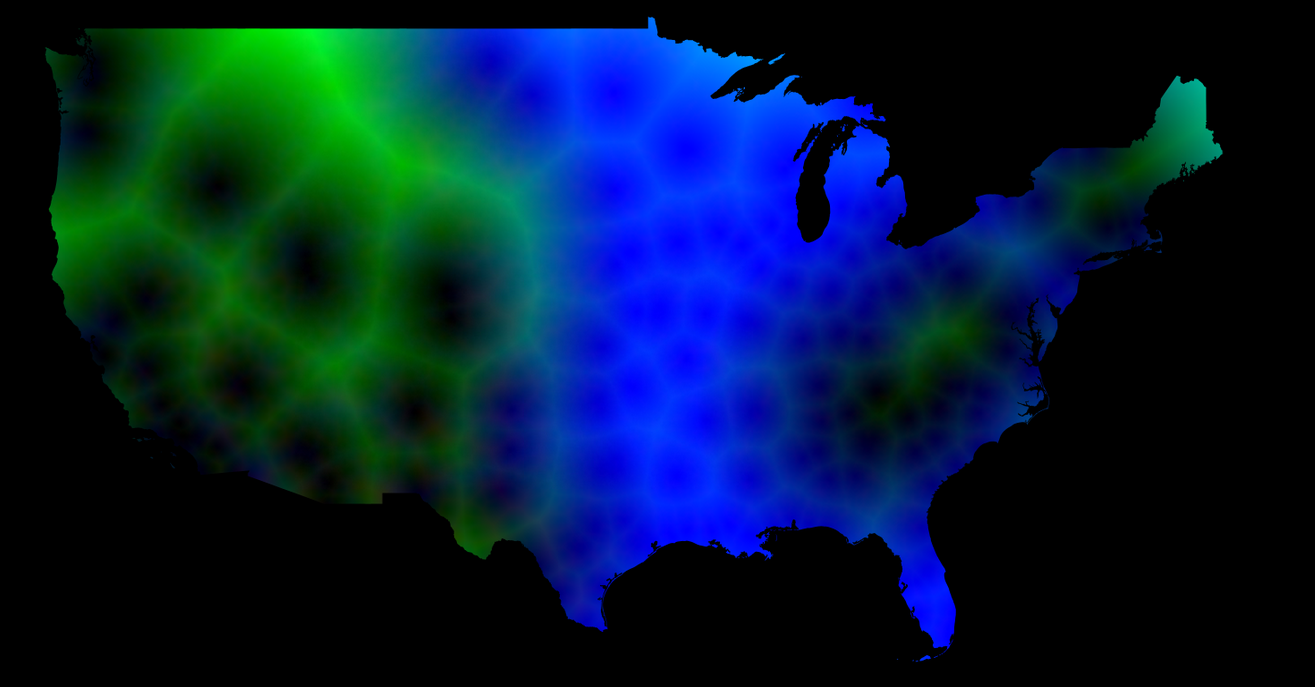
When you got a hammer, all problems are nails. Doing a distance composite again. This time for the continental US, using distances from peaks, inland water, and bright nightlights.
Week 25 (2021-11-04): Rio de Janeiro Distances


Got something more directly inspired by my actual work today. Here we have a portion of the state of Rio de Janeiro, with distances to mangroves (Mapbiomas), bodies of water (GSWE), and major highways (SNV) constituting the RGB bands.
Week 24 (2021-10-28): Dutch Pumpkin
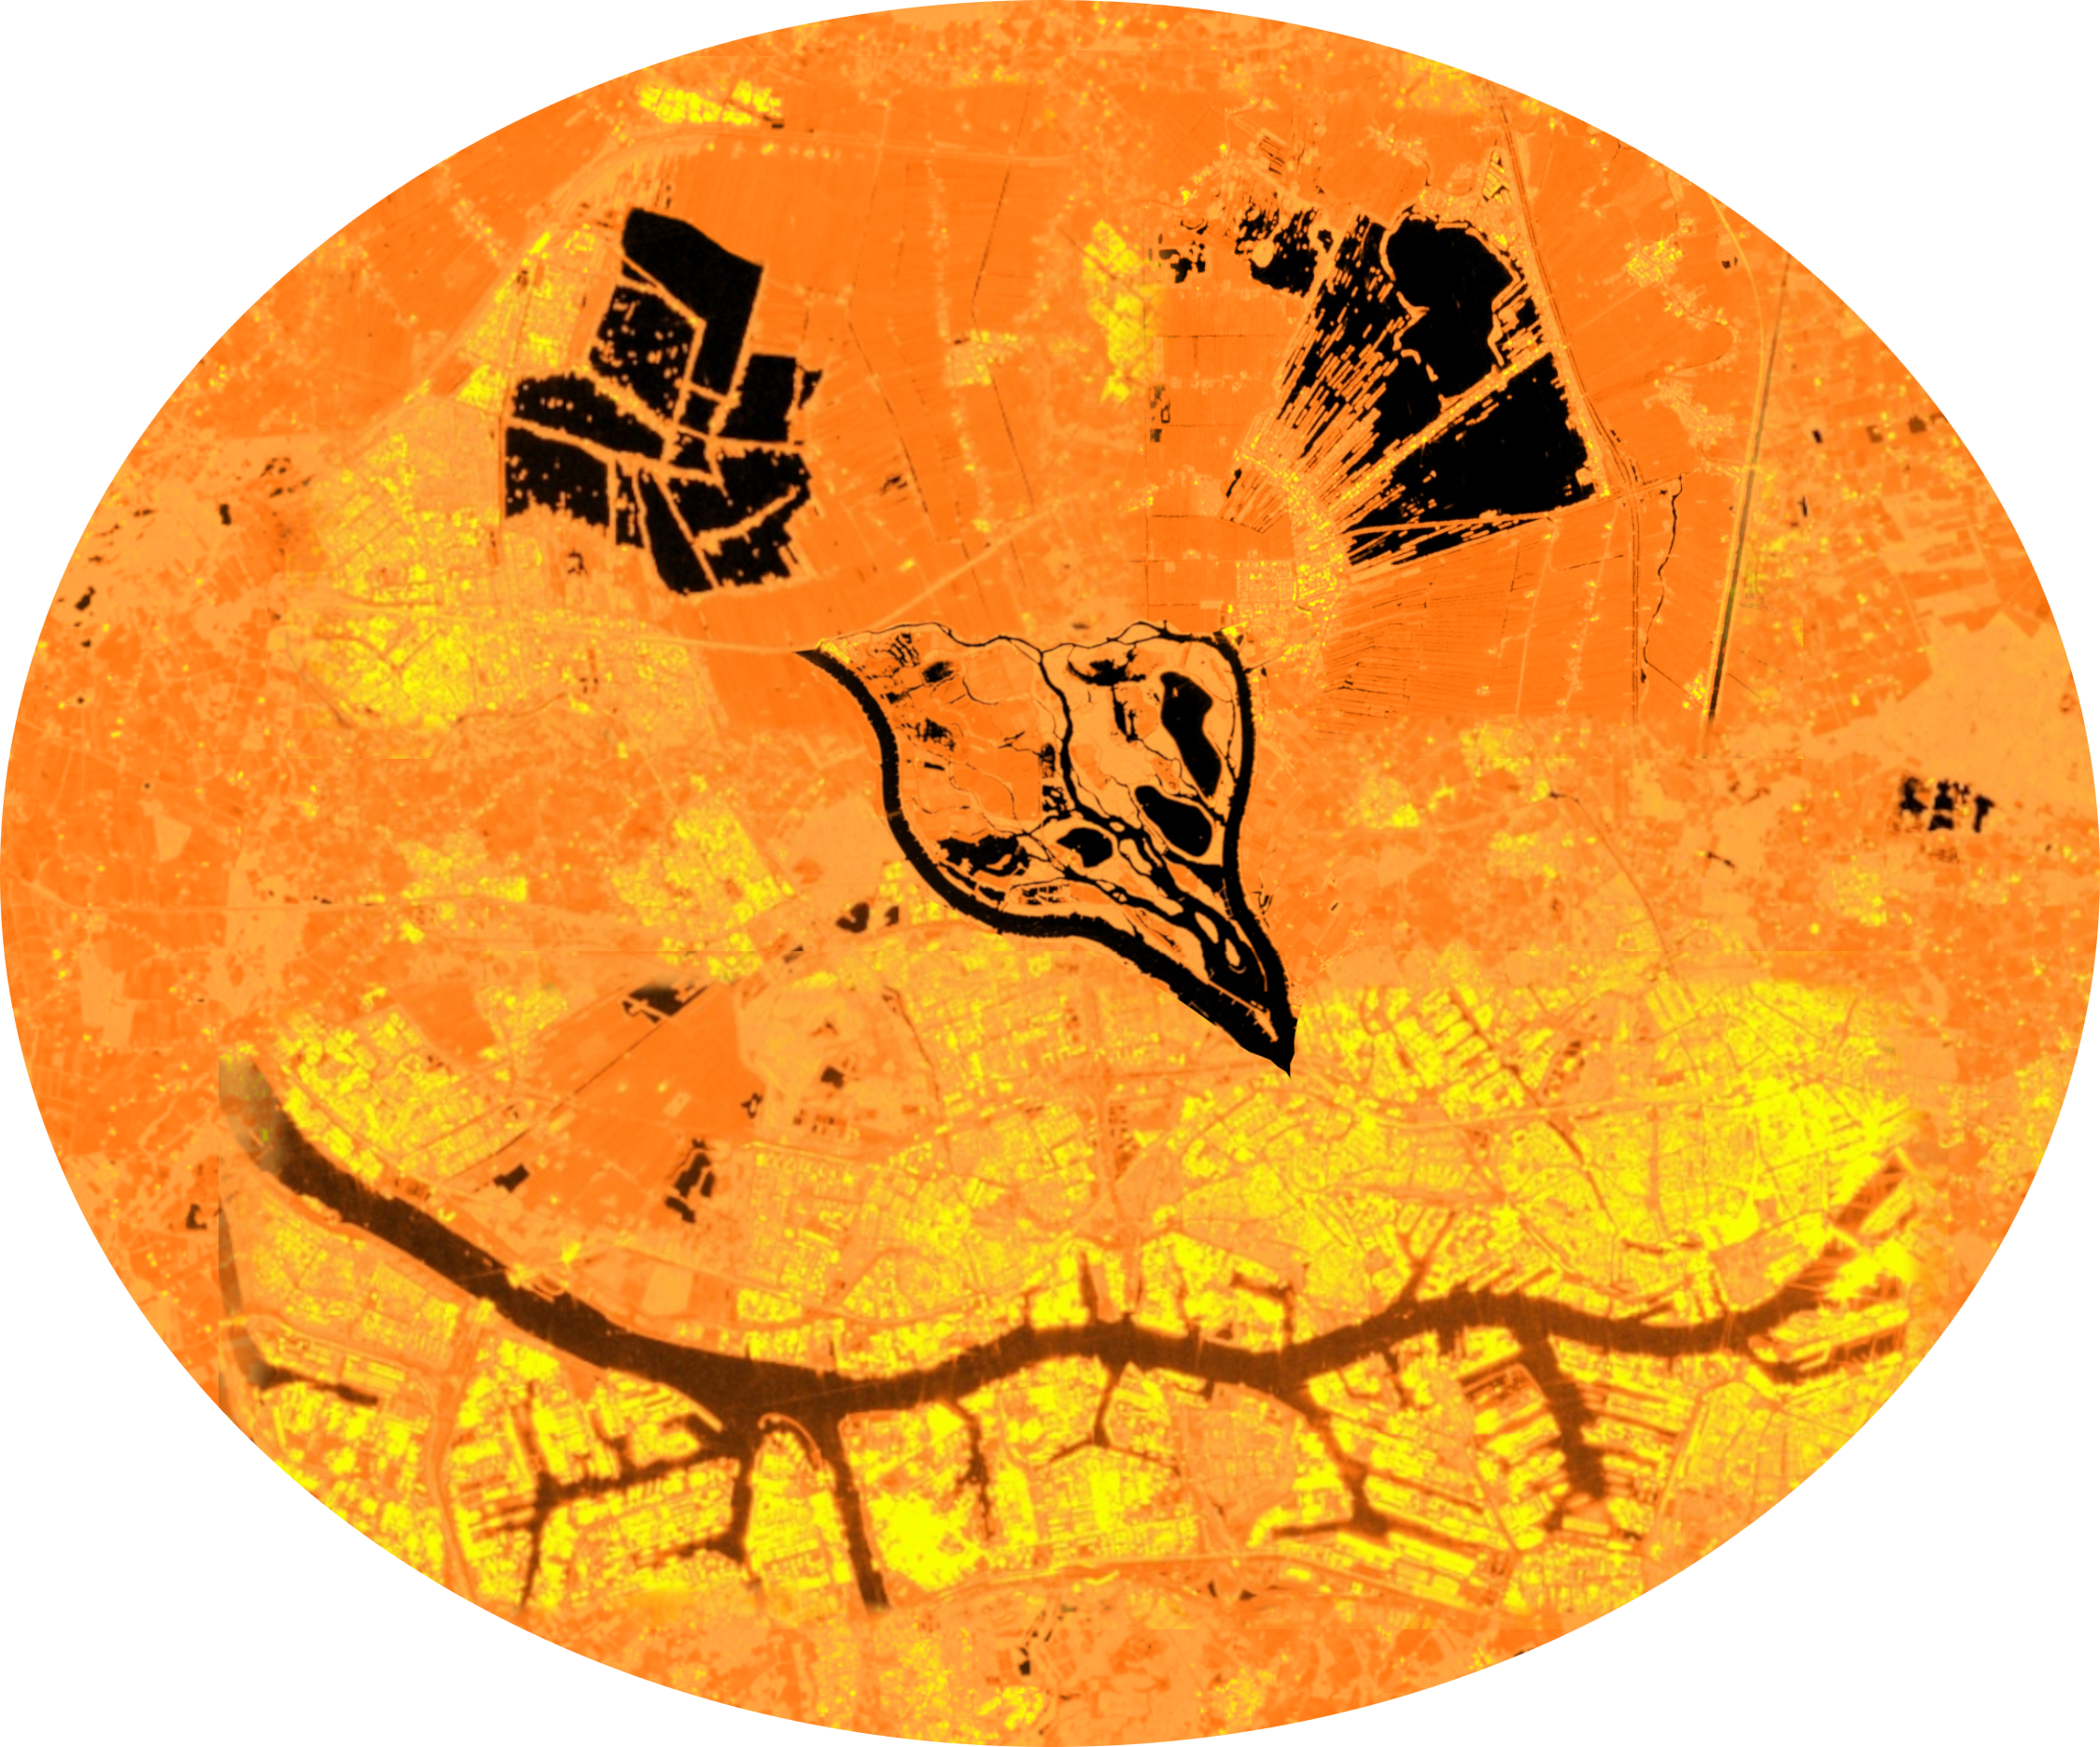
It’s Halloween week so I put together a remote observation jack o’lantern! I made this by mosaicking different parts of the Netherlands with Sentinel 1 SAR imagery. The right eye is Vinkeveense Plassen and the mouth is Rotterdam, for instance. I leave the identification of the remainder as an exercise for the reader.
Week 23 (2021-10-21): River Timelapse

This one is based on a timelapse of the White Nile River, just north of Rabak, in 3 month chunks from isolated fall of 2015 through winter of 2020, using the @USGSLandsat 8 water flag. Shoutout to @jstnbraaten, whose tutorial inspired this.
Week 22 (2021-10-14): Fire Currents
Another video! This has a foreground of large fires in the western US at a 6 month timescale as detected by the Aqua MYD14A2.006. Background is HYCOM ocean temps for North Atlantic over the course of a week.
Definitely dissatisfied with the relative slowness of the background relative to the foreground. A lesson learned.
Week 21 (2021-10-07): Fourier Timelapse
For this one, I took @NASA_Landsat imagery of farmland around Clinton, IL in 2 month chunks from 2016-2018; computed NDVI to highlight the vegetation growth cycle; and then took the Fourier transform of each image.
And here are the original NDVI images!
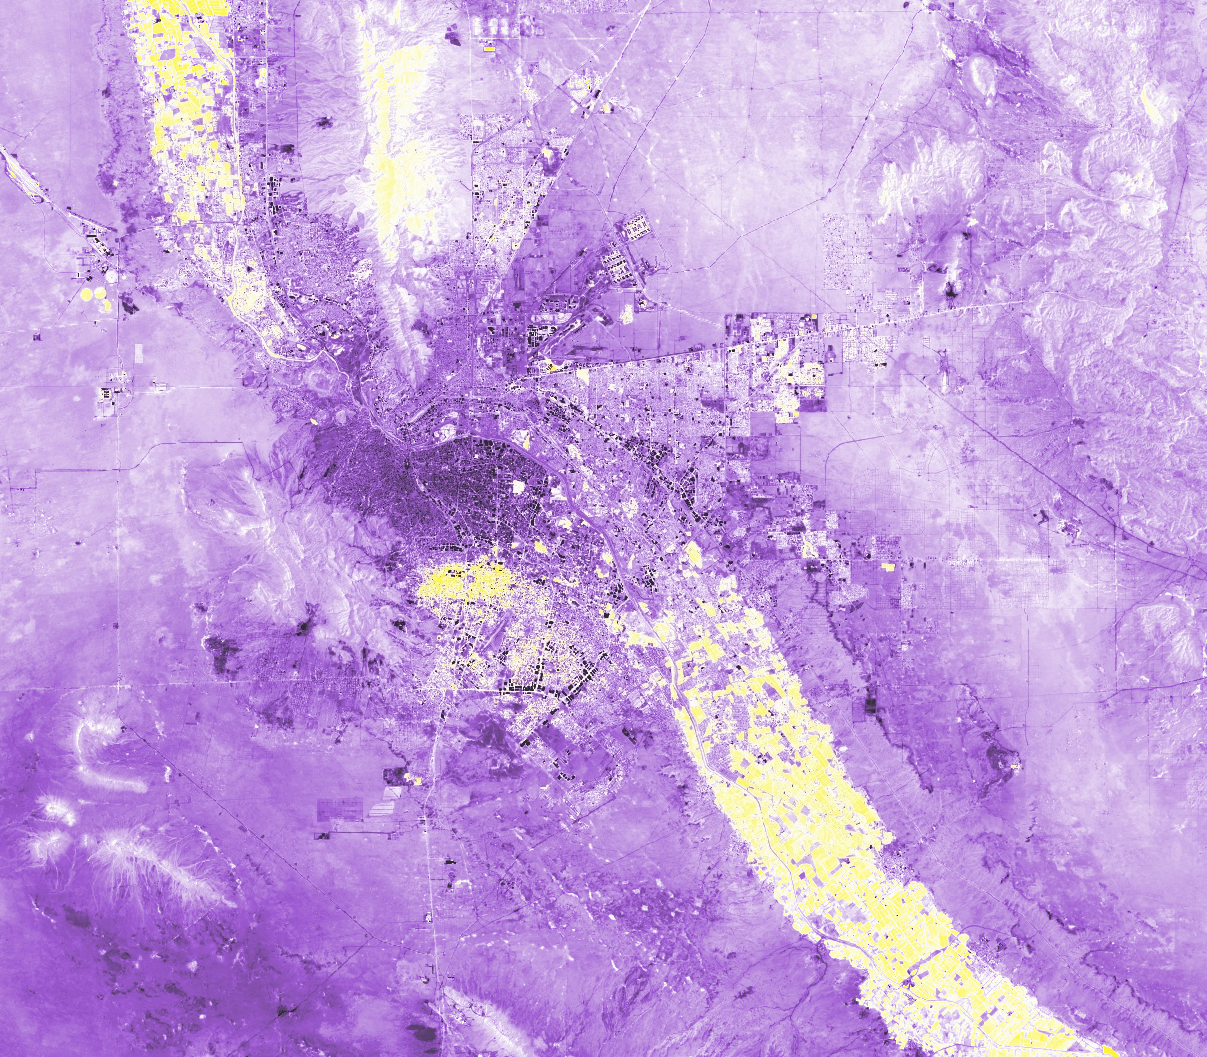
Week 20 (2021-09-23): Population Nightlights
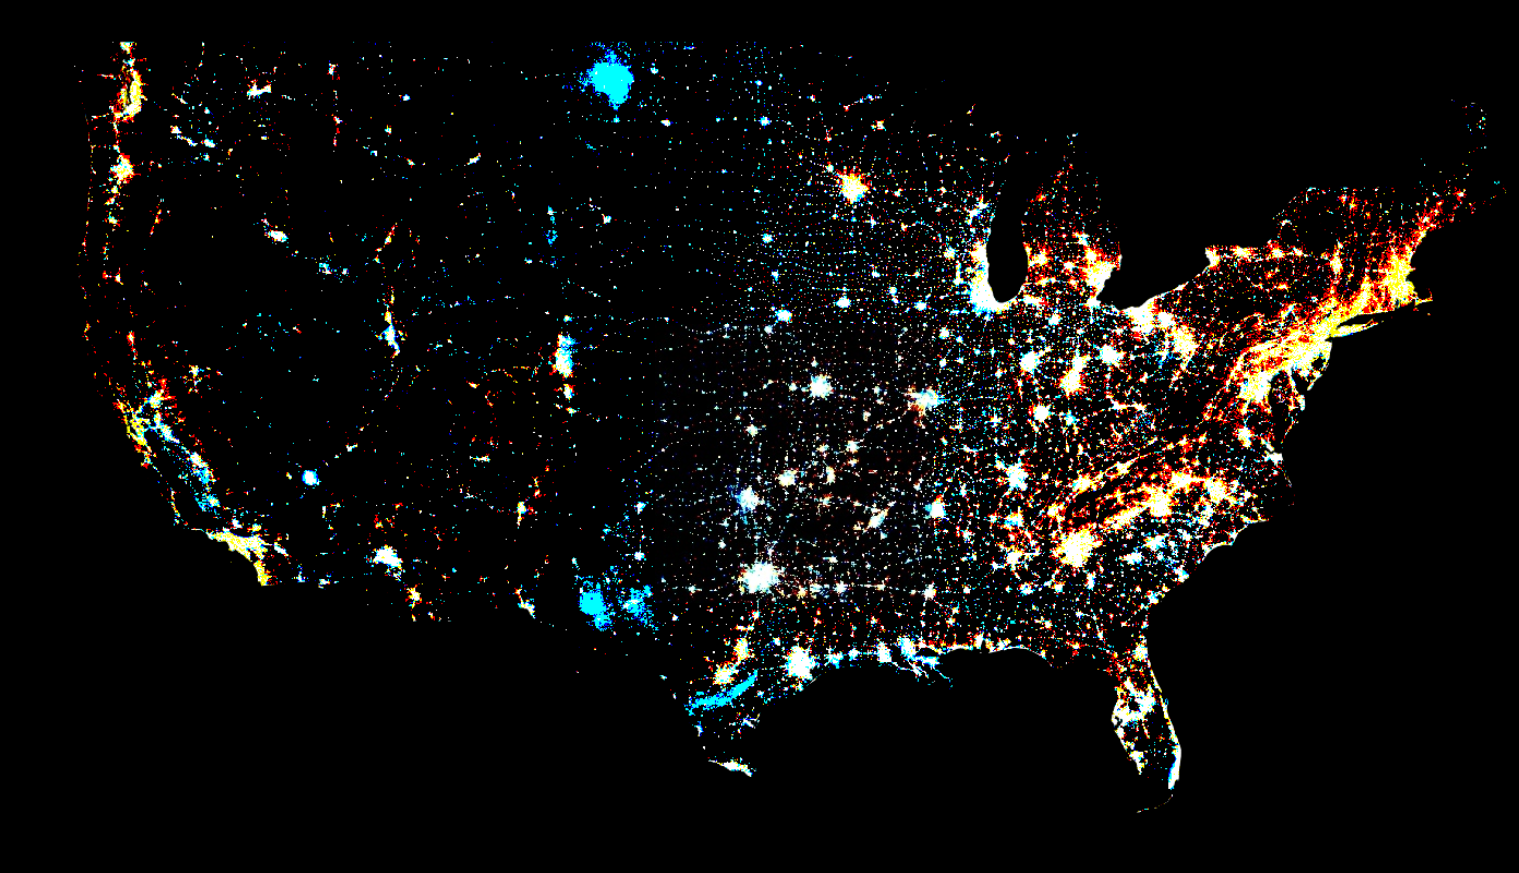
Using demographic data for the first time in one of these art projects! Combined SEDAC’s GPWv411 population with VIIRS nightlights. Blues mean nightlights are outshine population, reds indicate population is more dense than nightlights (for some comparison factor)
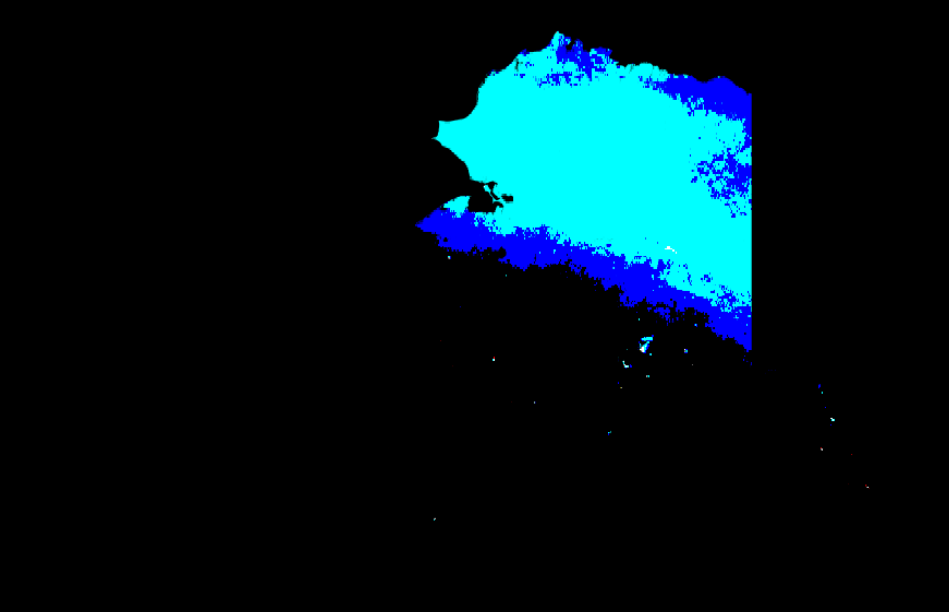
And I didn’t forget those not in continental US! Here is Alaska, where the combination of snow, auroras, and low population mean most of the northern portion of the state is brighter than it is populous.
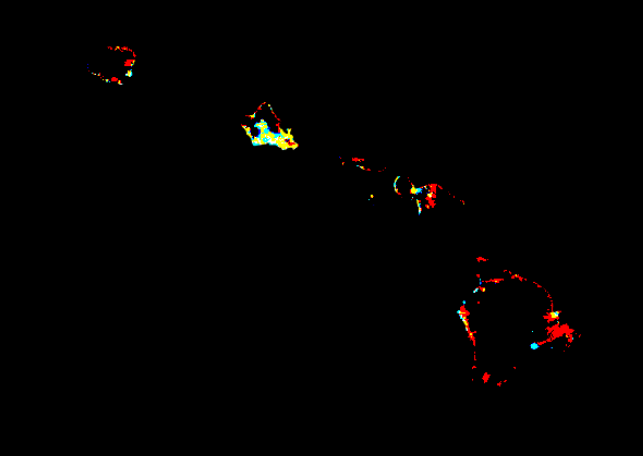
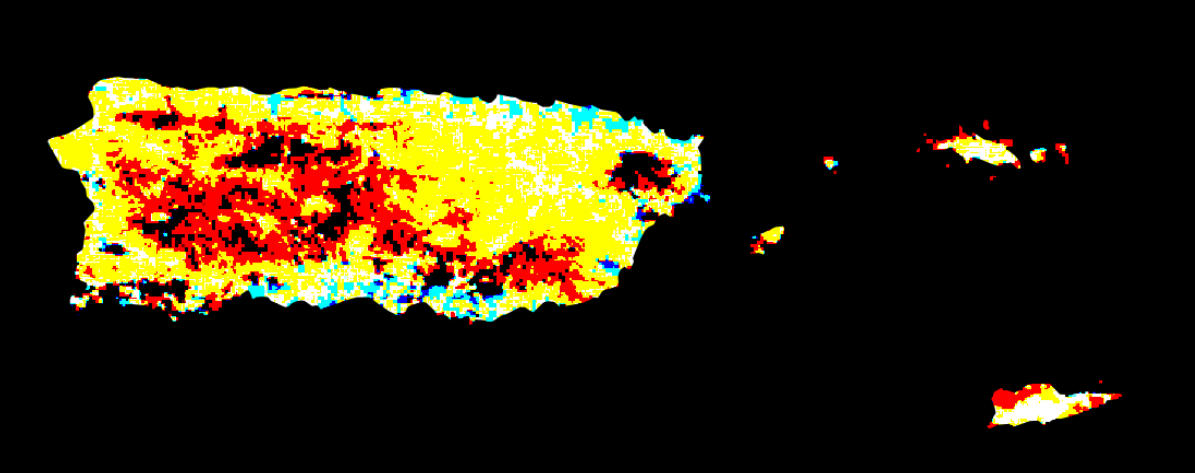
Hawaii and Puerto Rico meanwhile have relatively few nightlights despite high populations (PR more than HA).
You can even see variations within a city (here’s the Midwest).
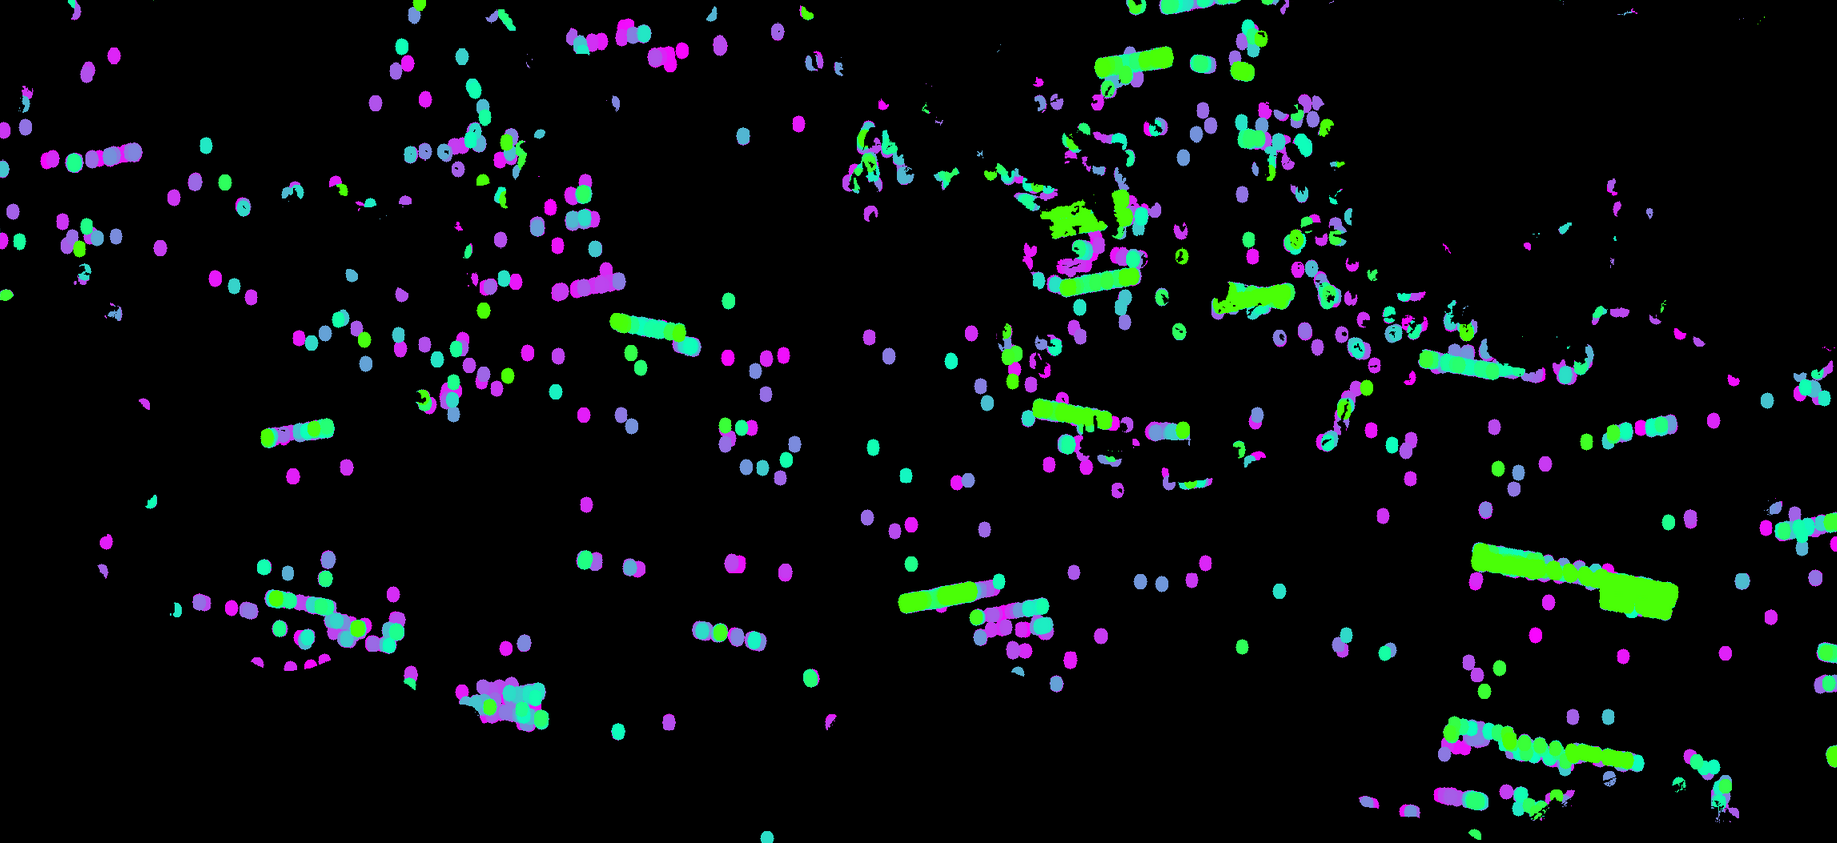
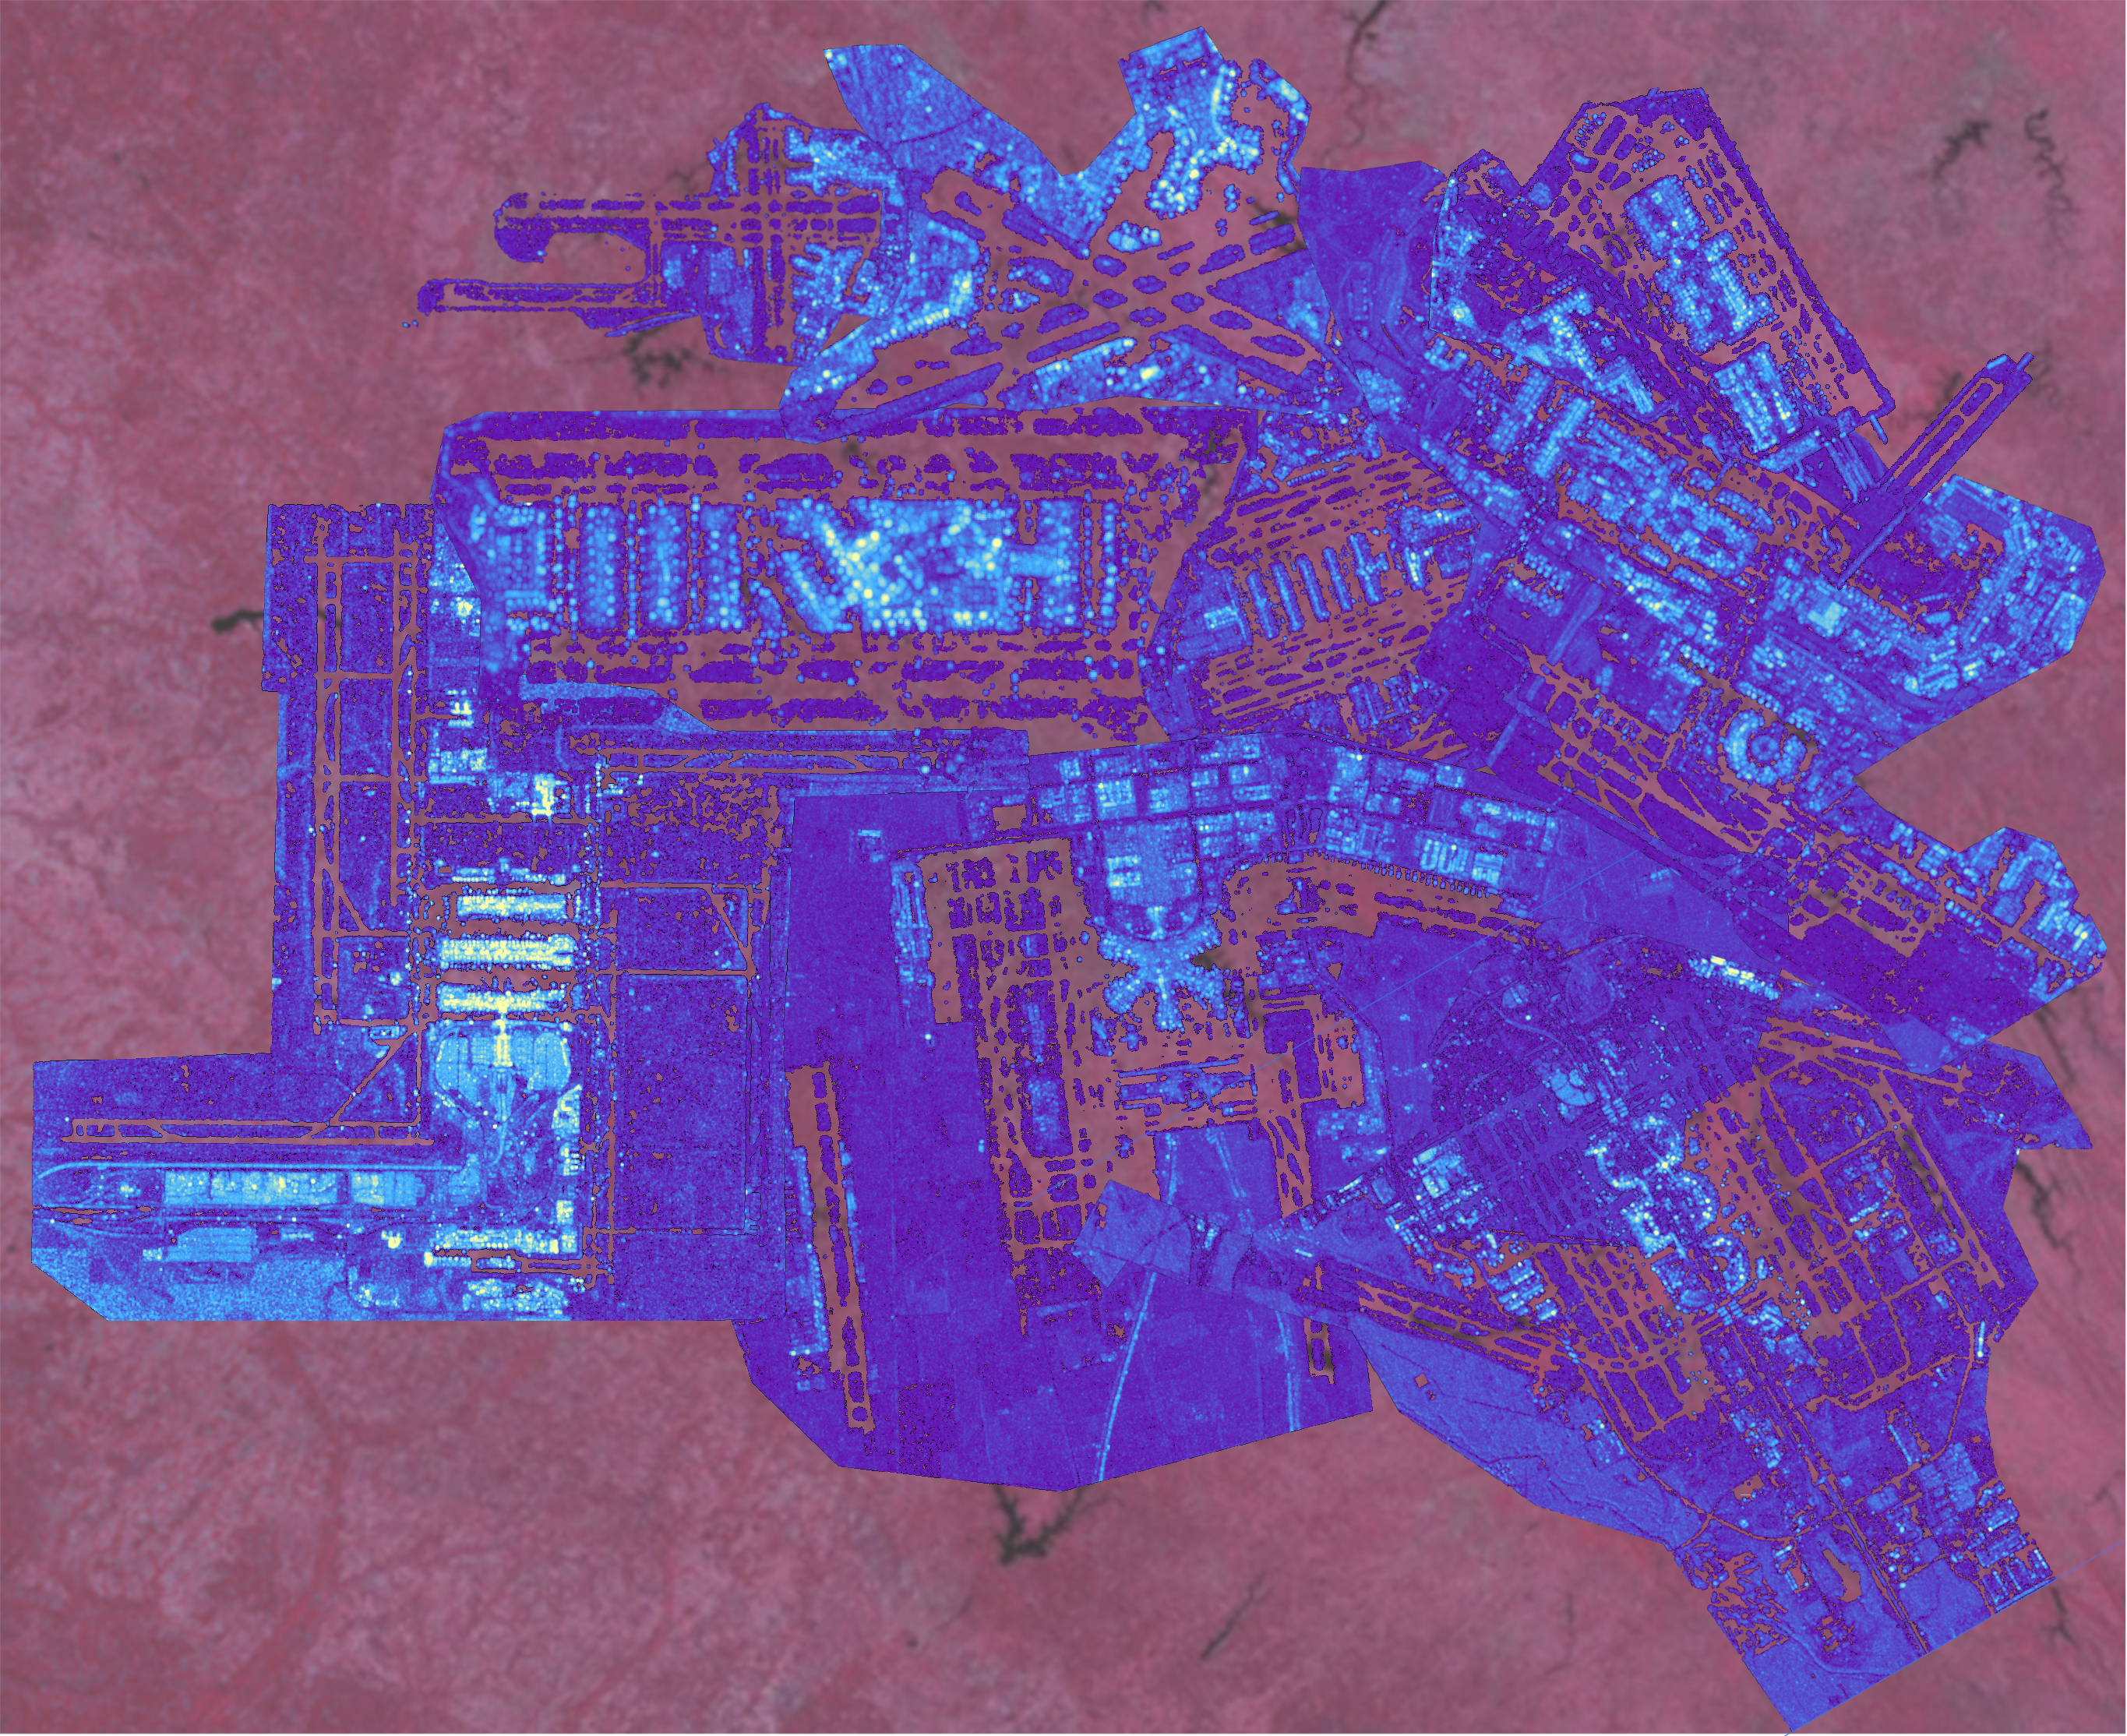
Week 19 (2021-09-16): Airplane Boneyard
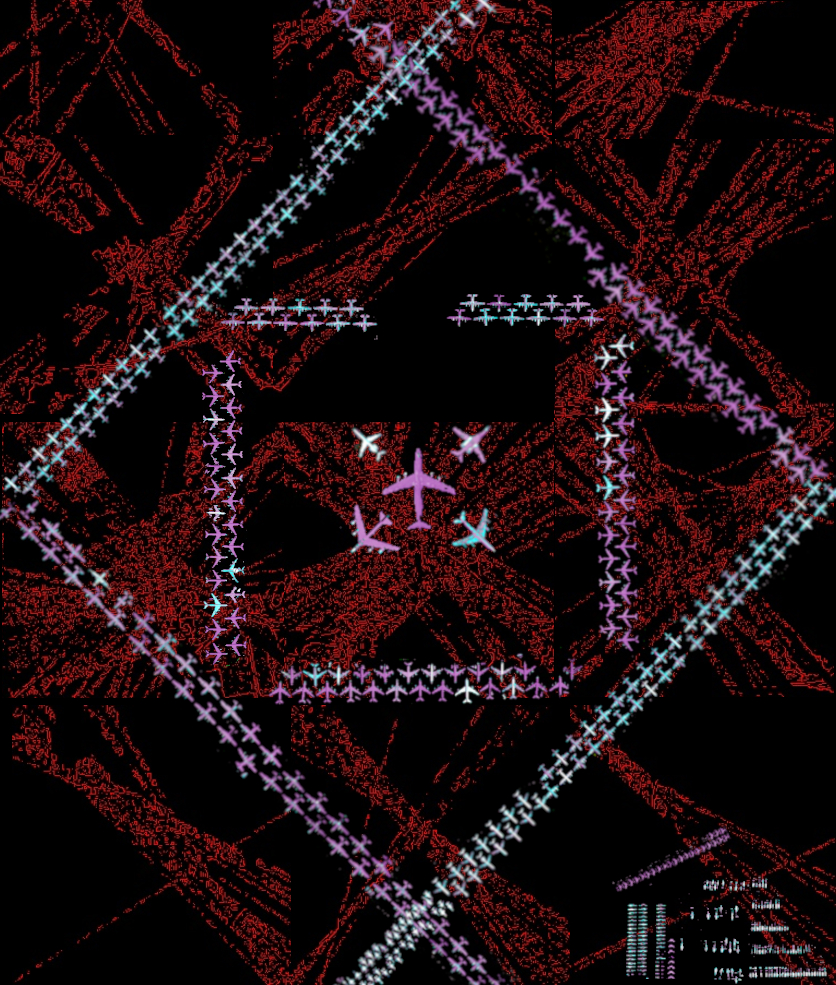
Just realized that #gee has some high res images. Foreground are aircraft from Davis-Monthan AFB (rearranged by me), filtered using blue reflectance. Purple is low NIR reflectance, blue is high. Don’t know why the different planes have such different NIR reflectances. Background is some edge filtering artifacts from NYC.
Week 18 (2021-09-09): Global Surface Tempreature
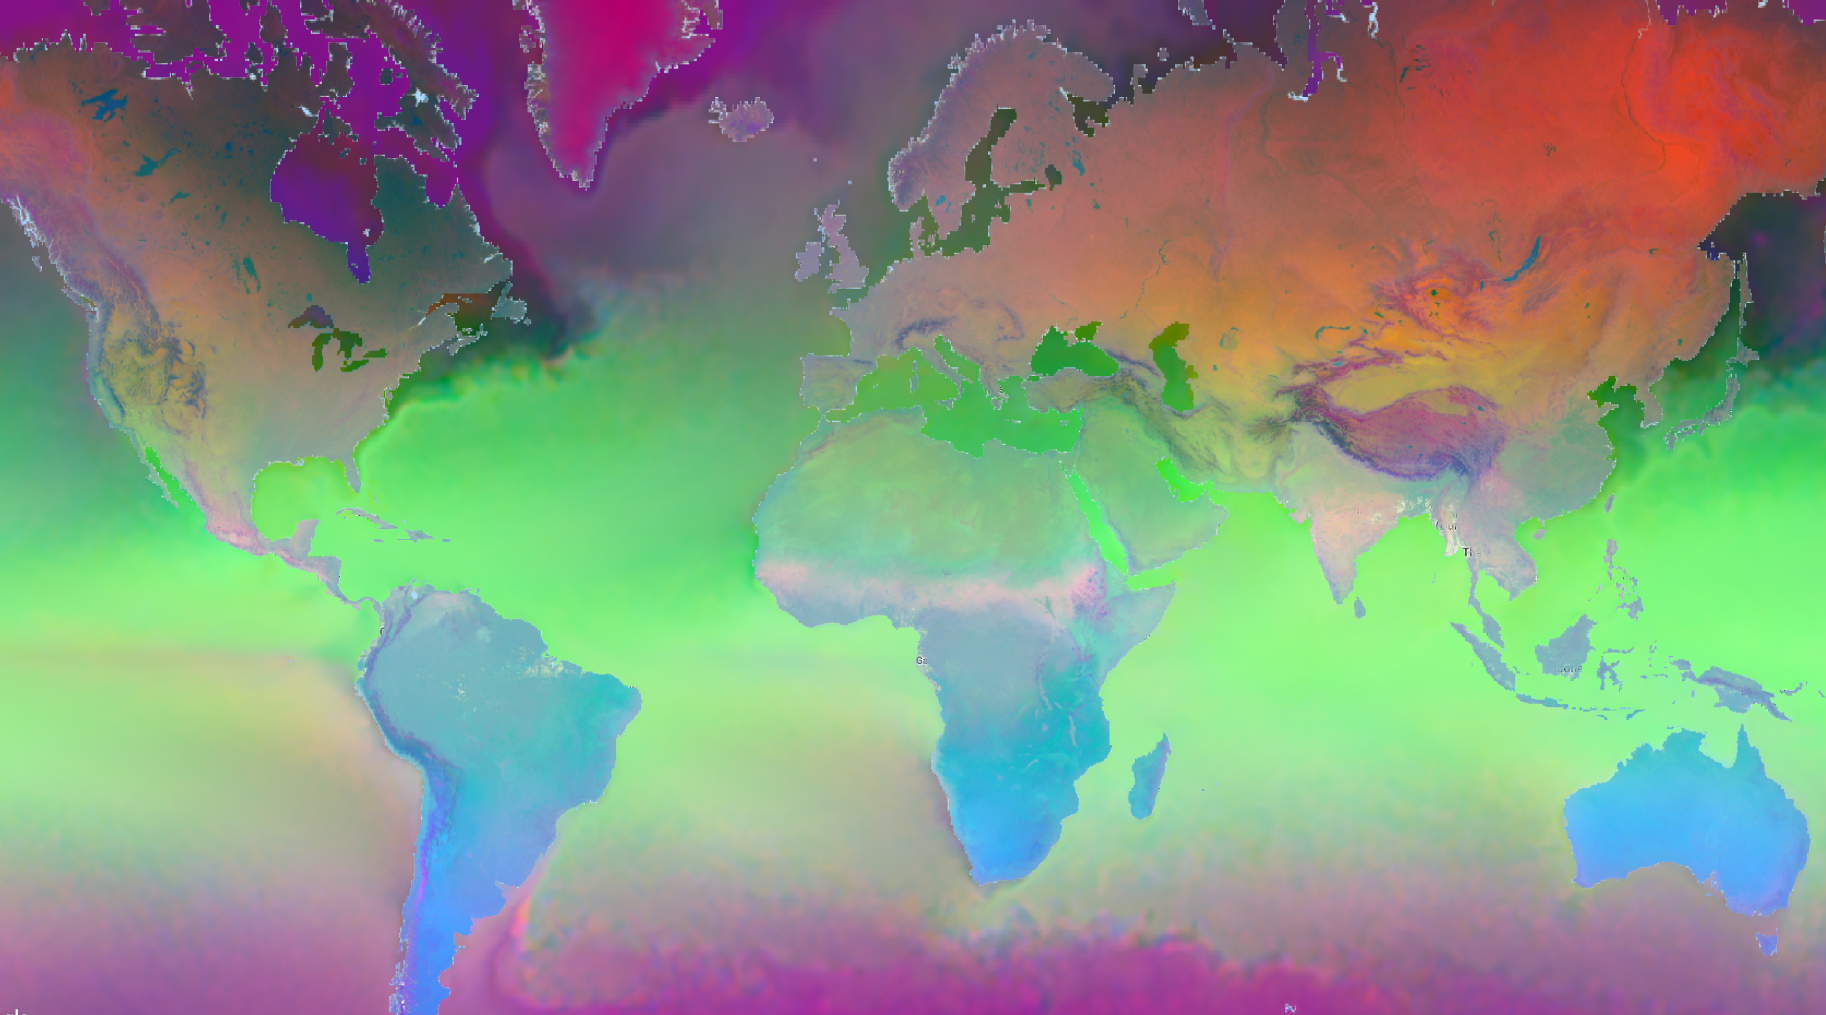
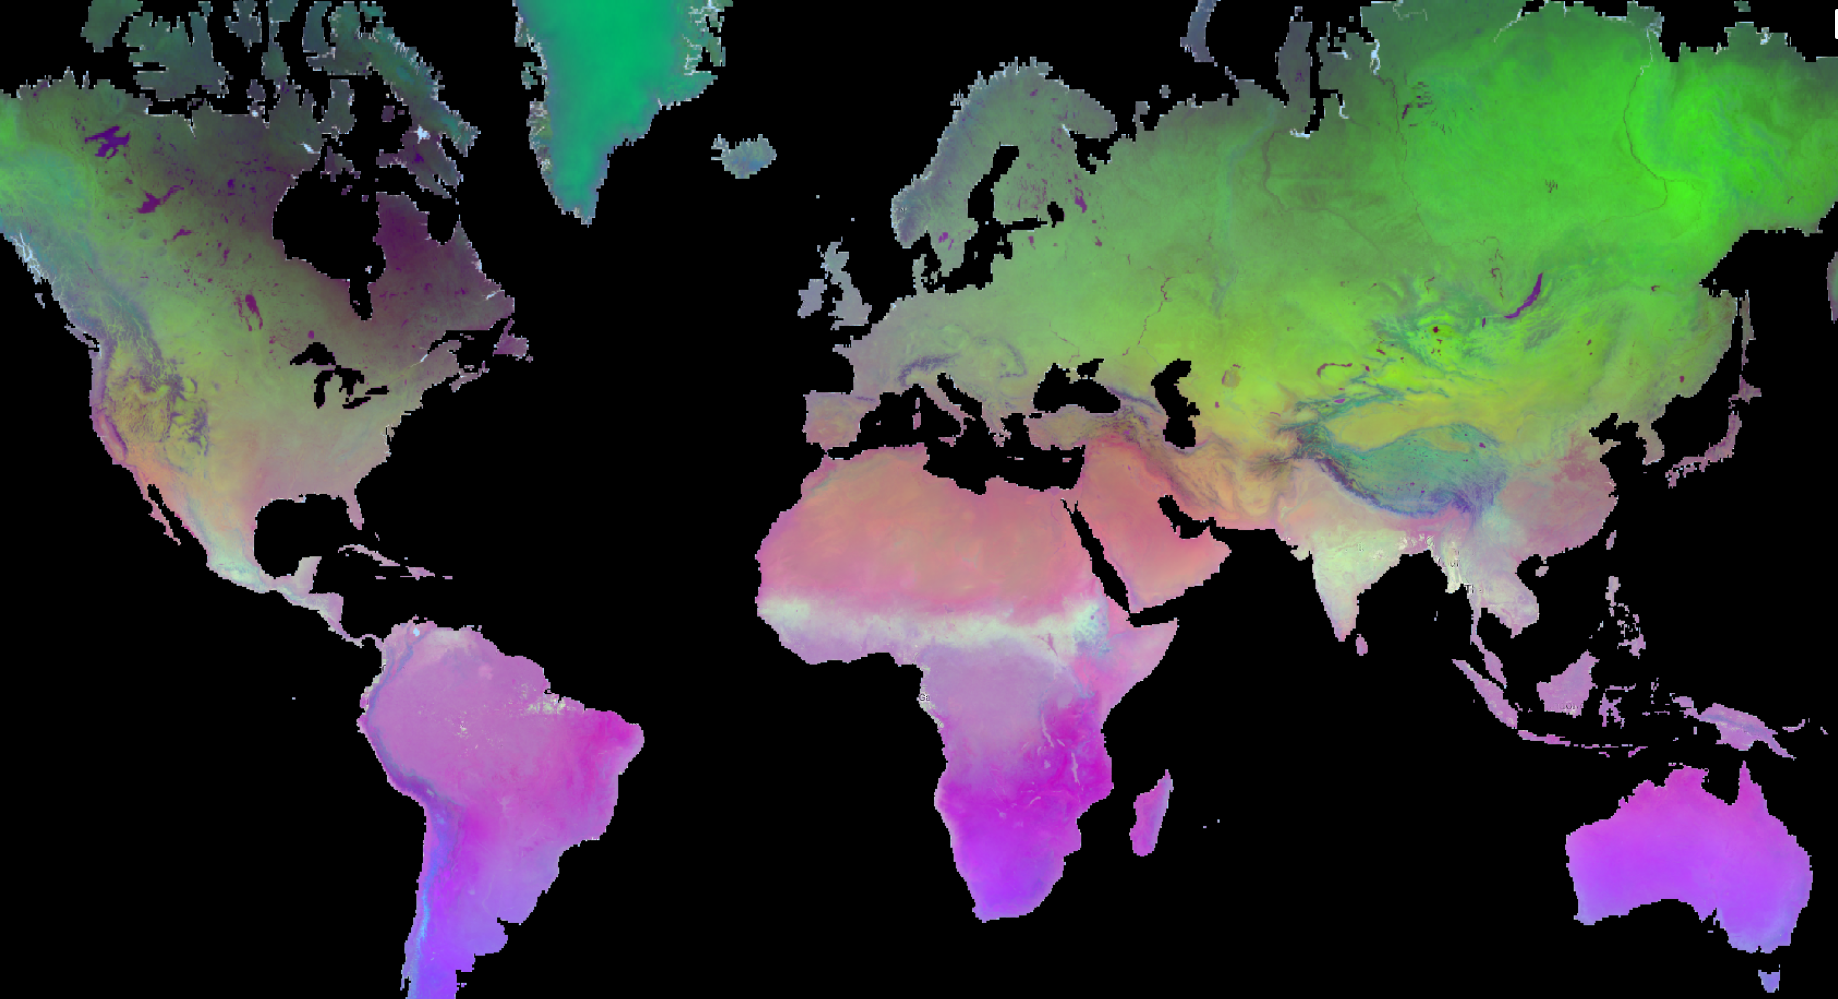
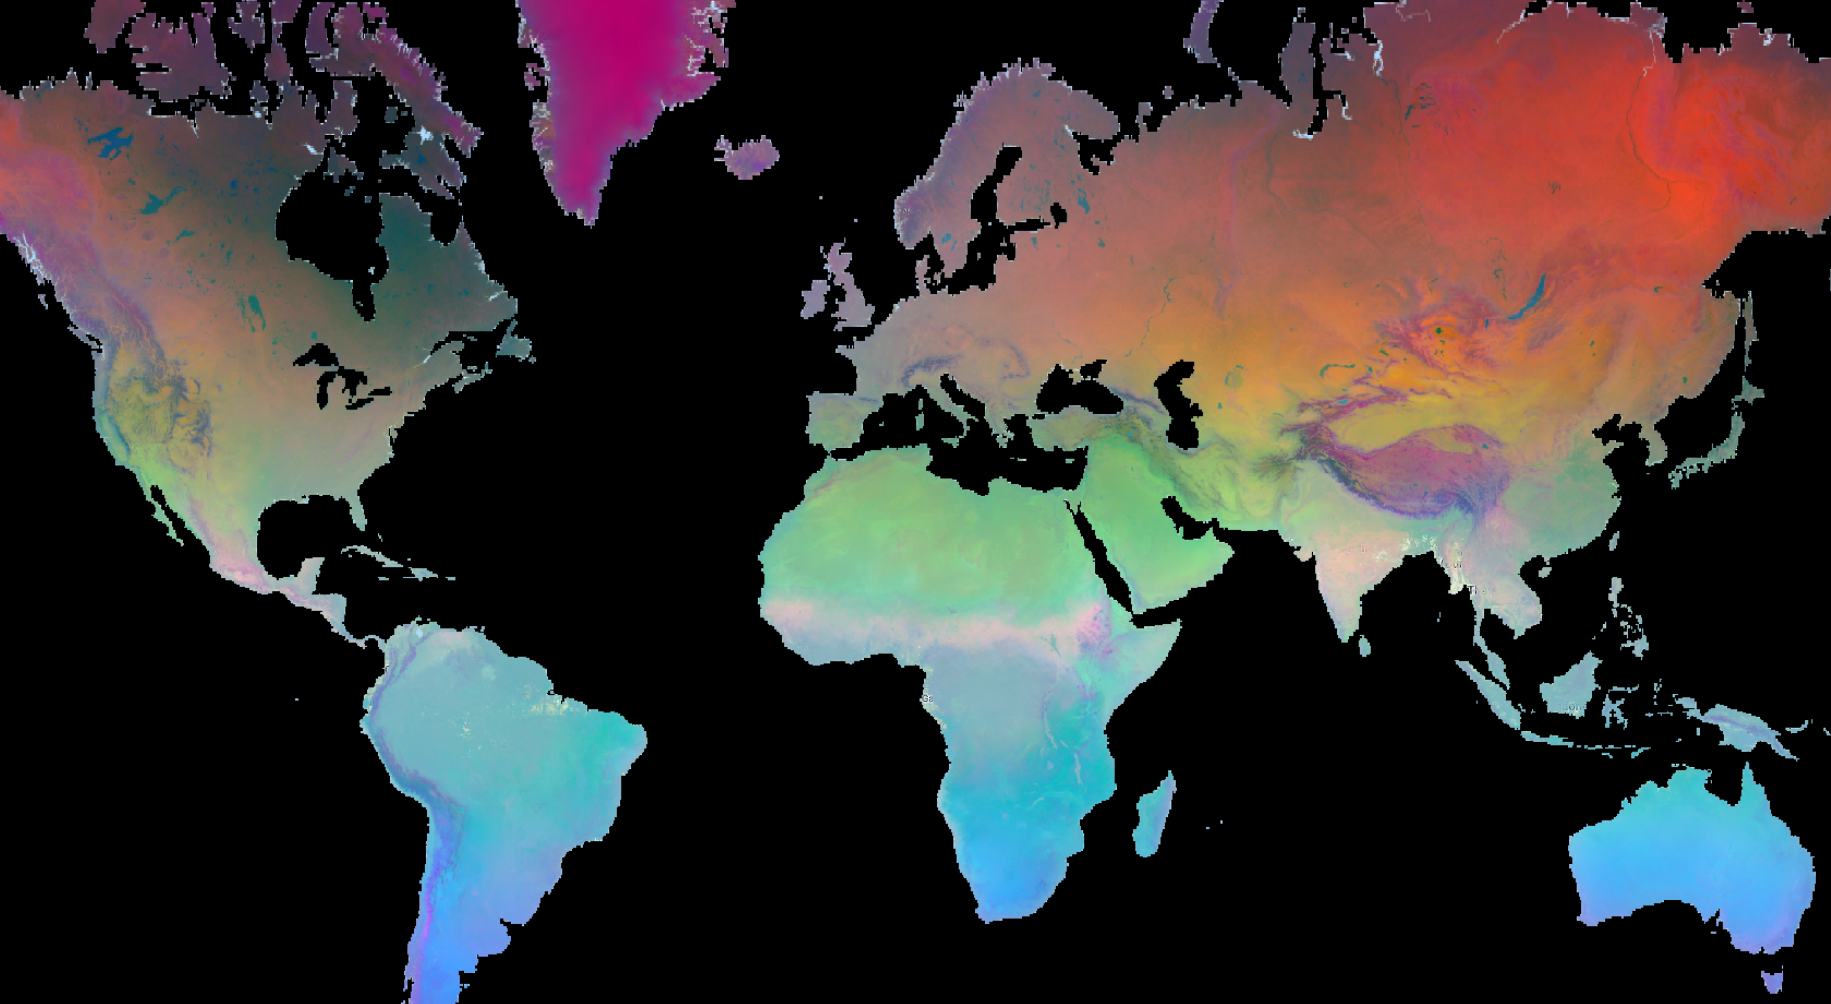
A look at surface temperatures (Jan-Jul diff, Apr-Oct diff, and annual mean). Not entirely satisfied with the oceans (lower resolution than land) or the overall projection. Using MODIS-based OpenLandMap for land and NOAA CDR OISST for ocean.
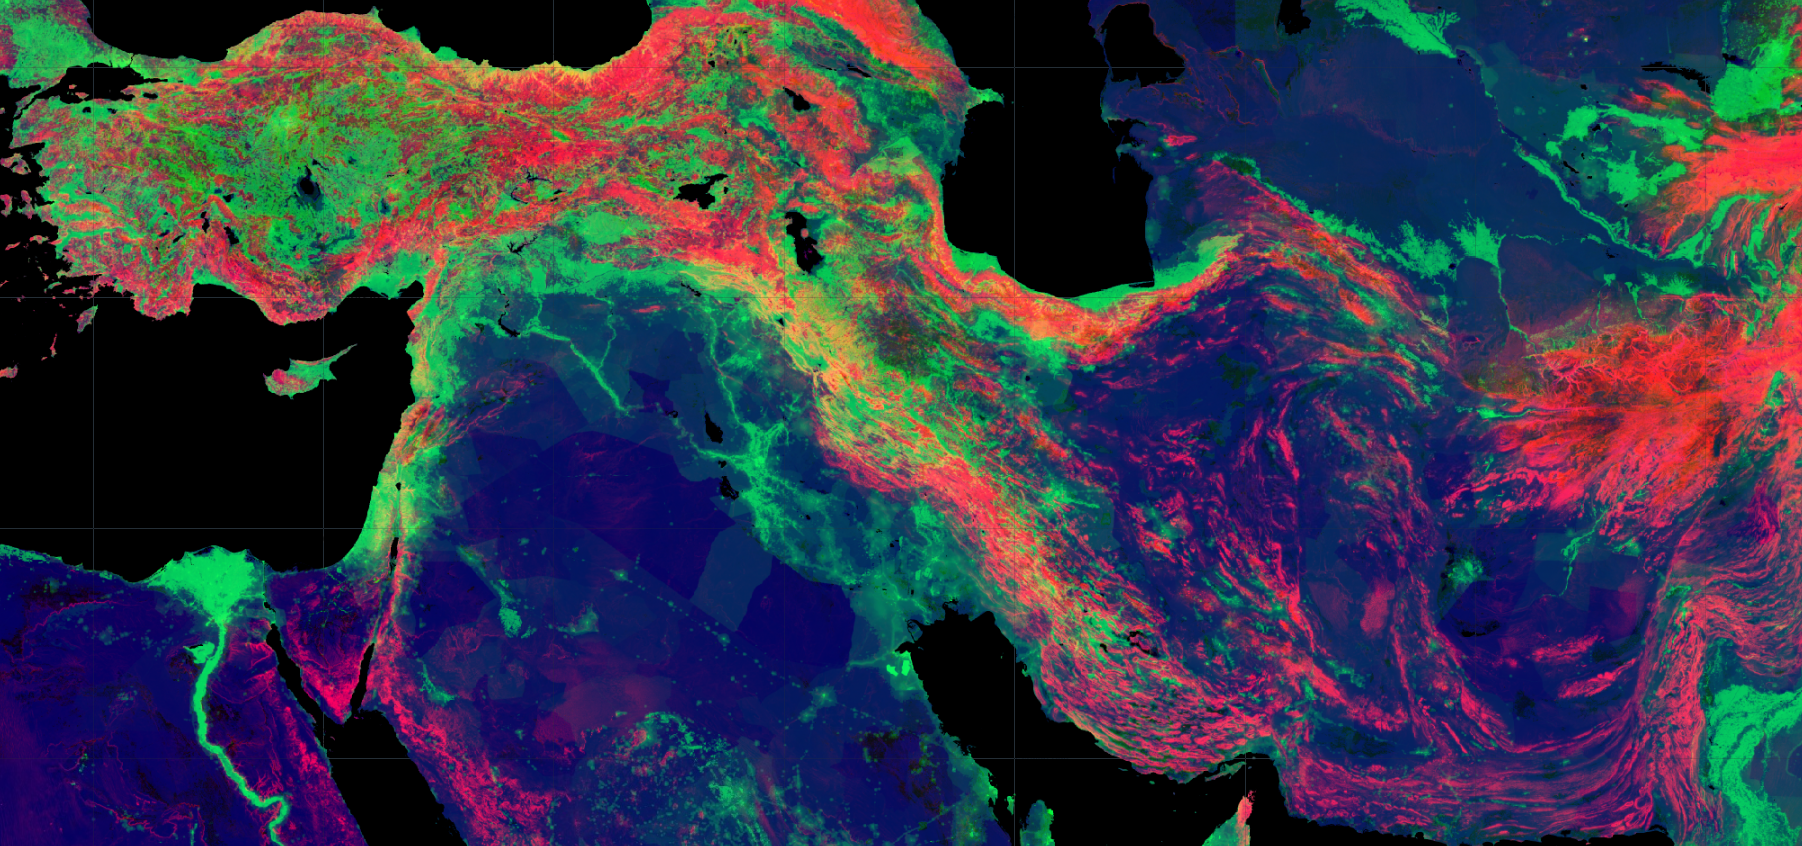
Week 17 (2021-07-15): Low Lands
This one is an SRTM composite of several areas from around the world with elevation below sea level (places like the Dead Sea valley and Death Valley), overlaid on a background of Solitario, Texas.
Week 16 (2021-07-09): Fourier
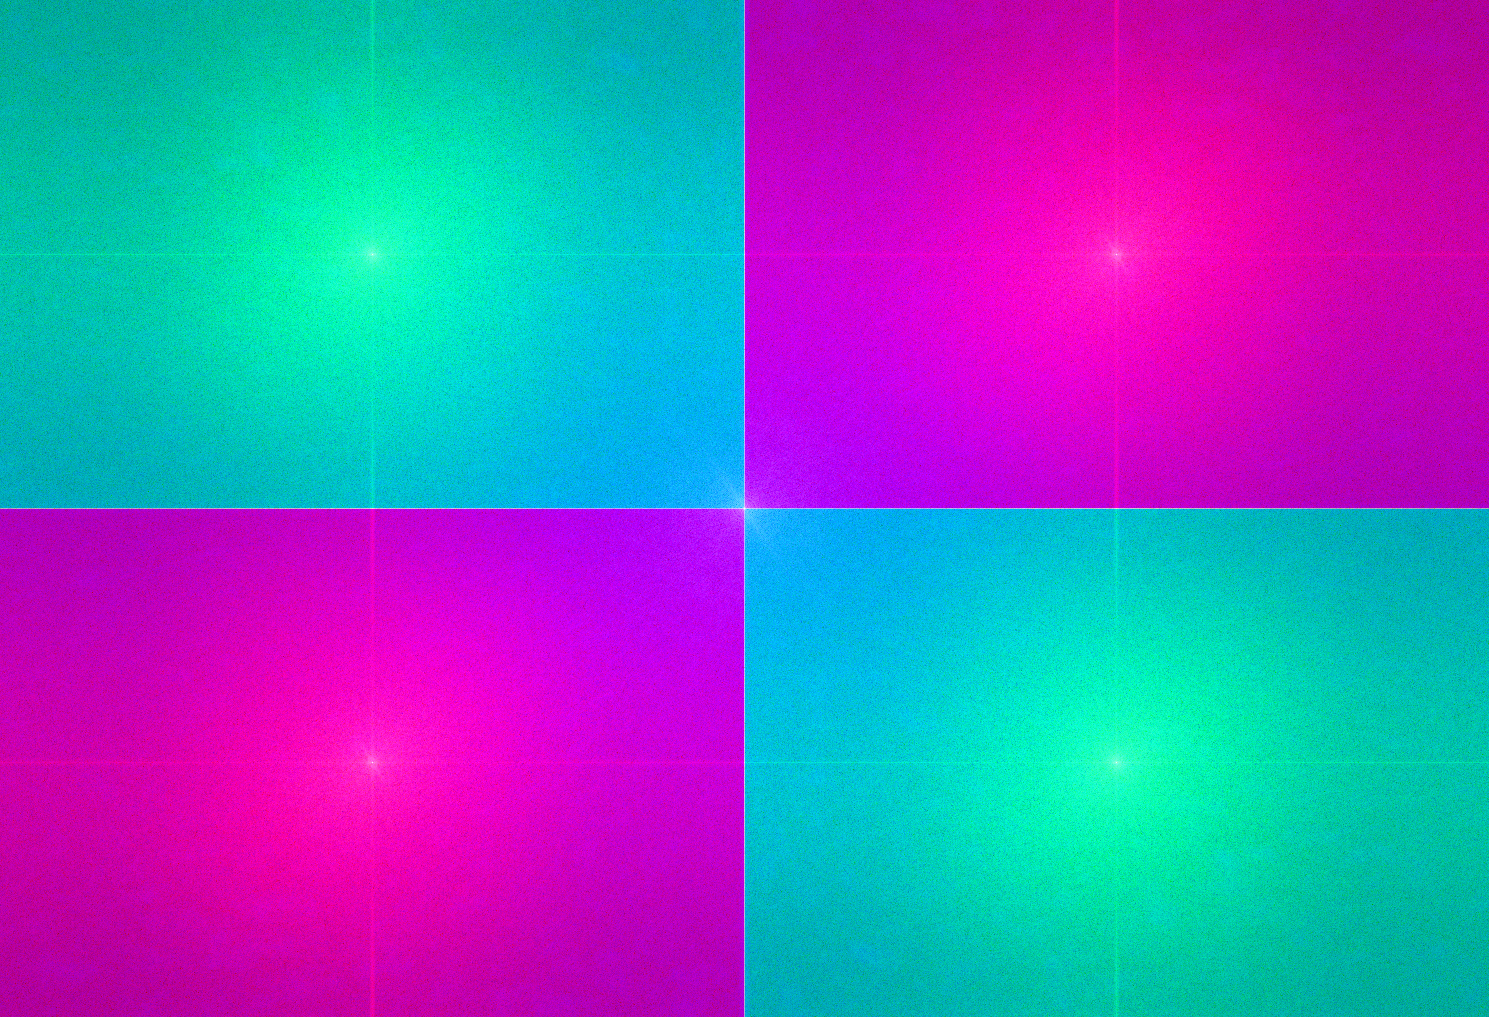
A day late. This time I took the NDVI, NDBI, and NDSI channels from Week 14, did a 2D fourier transform on each, applied RGB colormaps to each, and arranged them to get this result.
Week 15 (2021-07-01): Airports Composite
Not sure what to call this one. Its an amalgam of several airports from around the world as seen in Sentinel-2 SAR (can you identify them?), with a background of Landsat 8 IR. The gaps are runways. Kind of looks like a samurai helmet in profile.
Week 14 (2021-06-24): Egmont Normalized
Made this yesterday but forgot to post it. We got a right ol’ Eye of Sauron in New Zealand! This is the surprisingly circular Egmont National Park, as seen in a combination of NDVI, NDBI, and NDSI from 2013-2021.
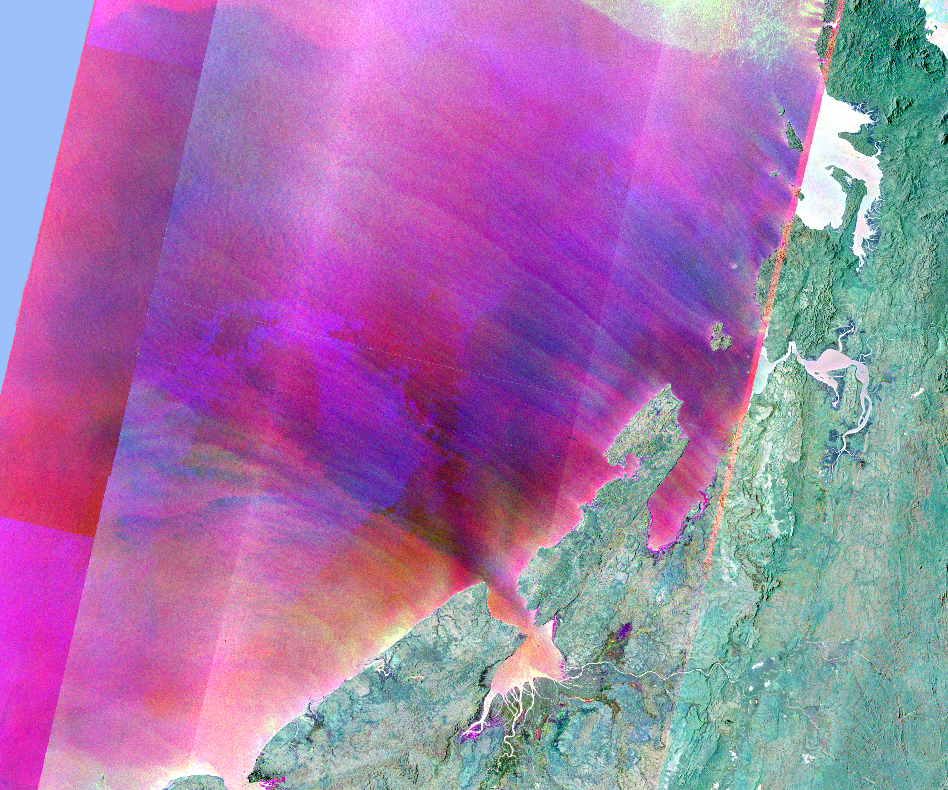
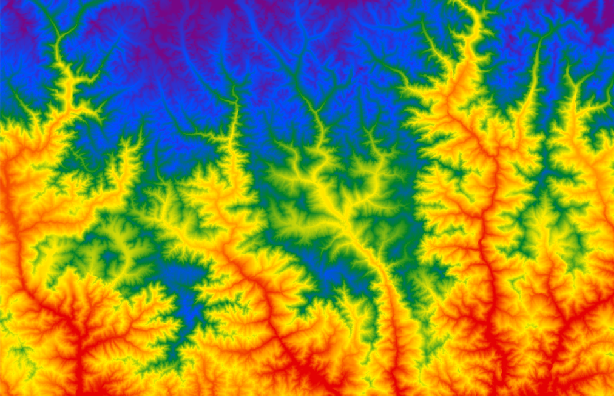
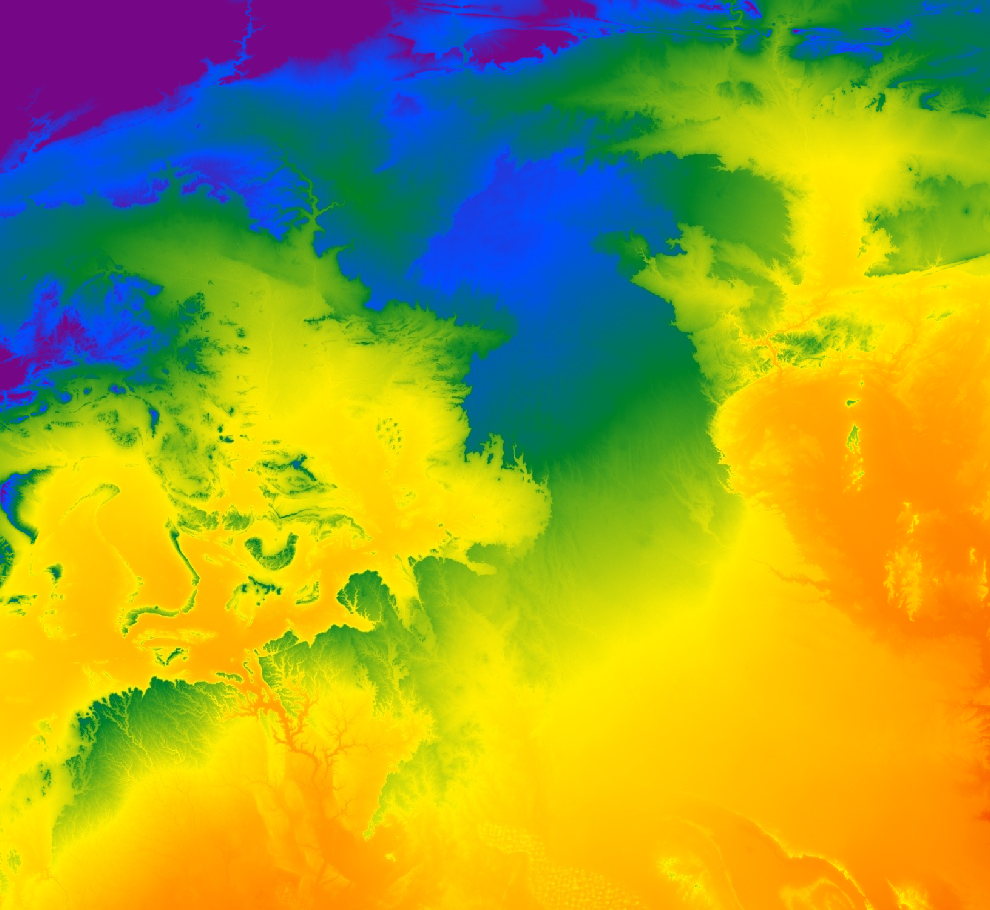
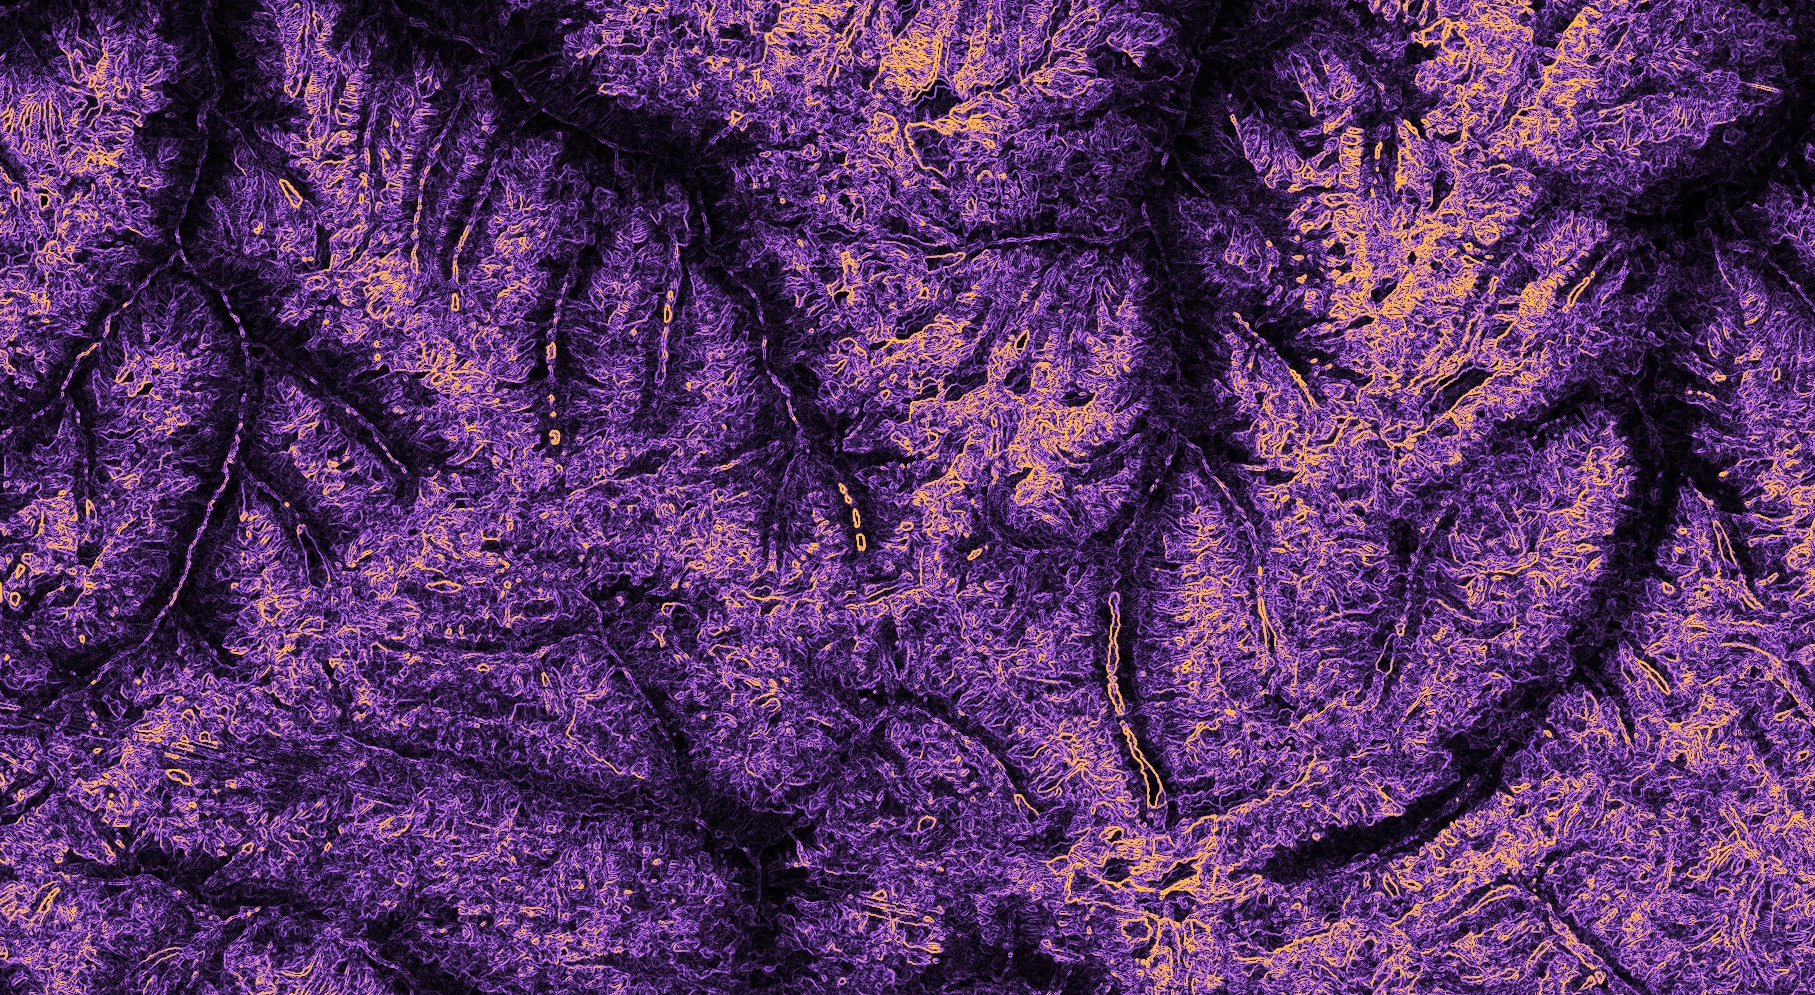
Week 13 (2021-06-17): Norway Gradient Elevation
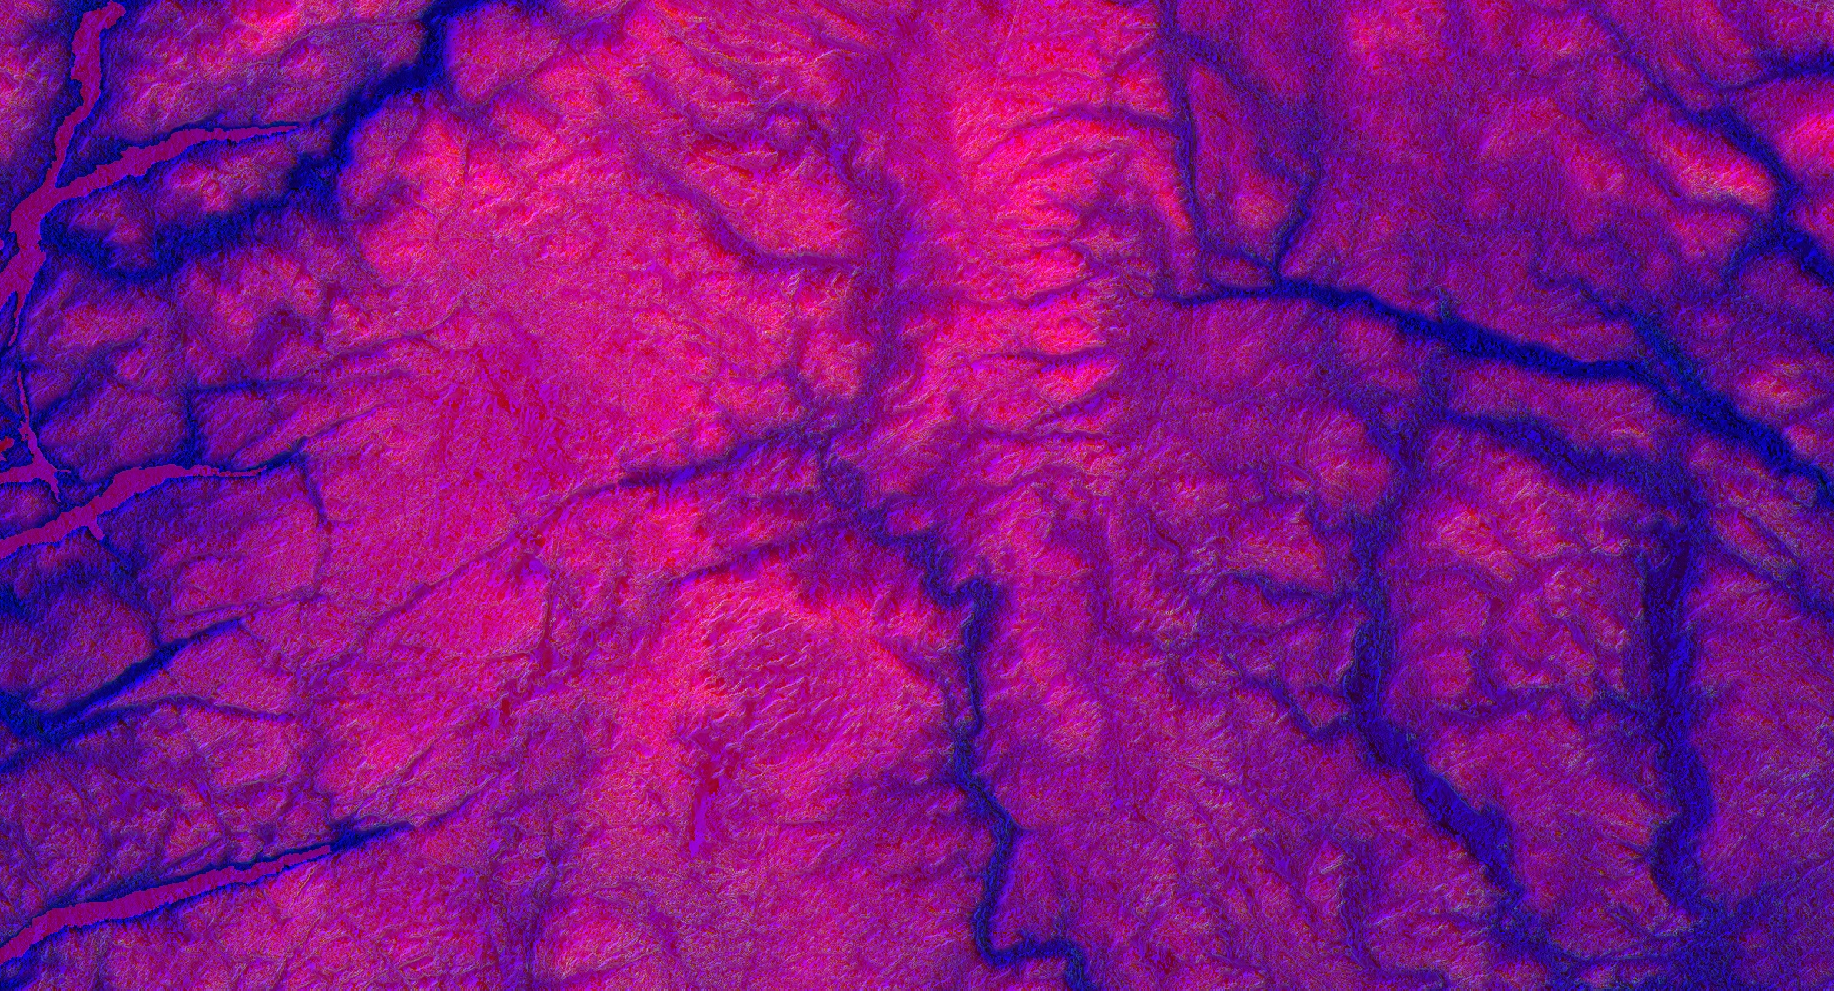
Got a weird one. The texture + resolution is giving me real Cronenberg Videodrome vibrations. It’s north Agder, Norway in a mix of SRTM elevation and @USGSLandsat panchrom gradient. I wanted to do Sognefjord, but it’s at 61°N and SRTM caps out at 60°N, sadly.
Week 12 (2021-06-10): Pride
![]()

Was off last week for traveling. Back with a set of pride-themed pieces. First is Landsat 8 NDVI of agricultural land just west of Tulare, California. Second is SRTM elevation of Bhutan. Third is the coast of Maryland & North Carolina in thermal IR from ASTER.
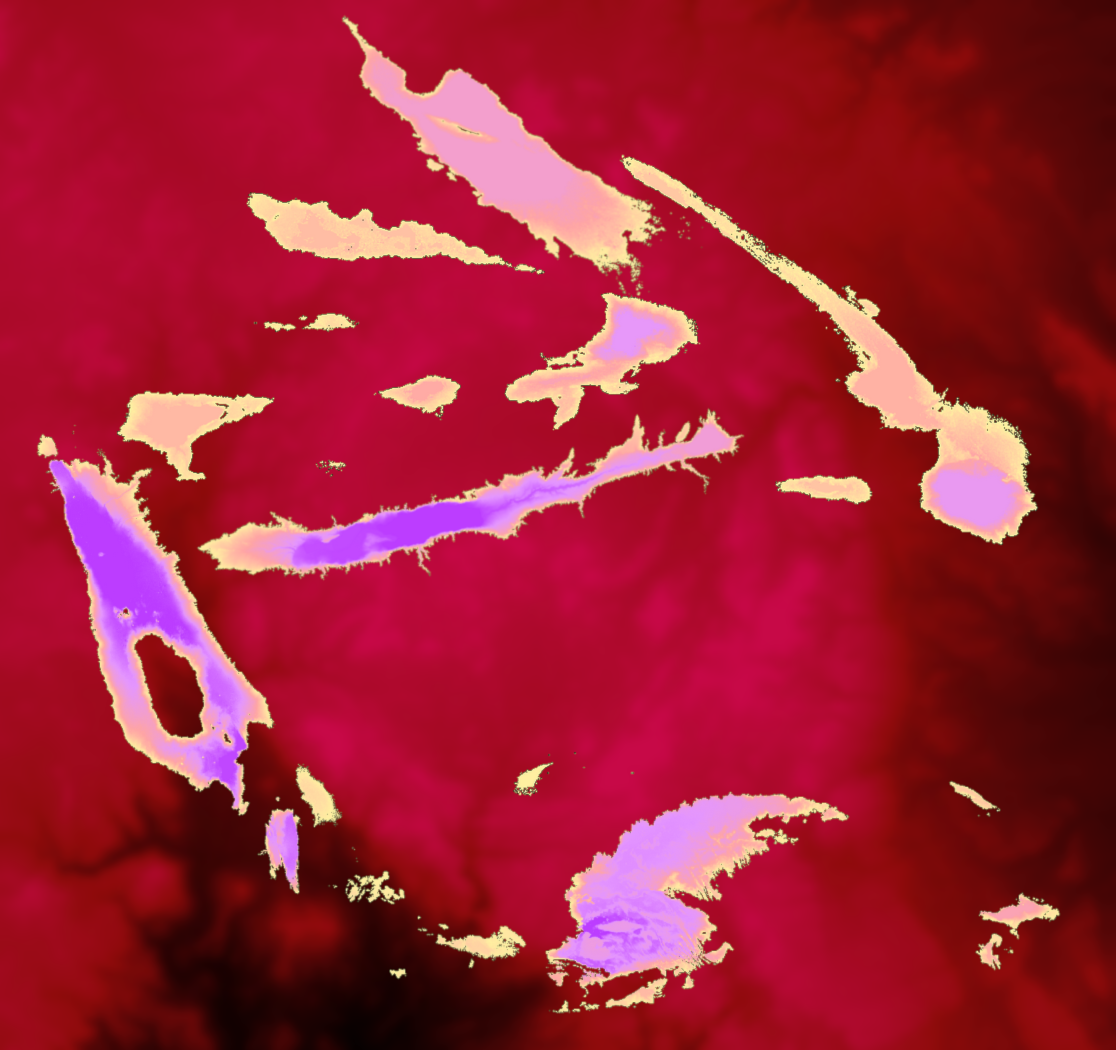
Week 11 (2021-05-27): Global Mountains
I decided to revisit the Week 5 process and expand it to a global version, highlighting peaks over 2000m and placing them on a background of Sahara Desert elevation. The Himalayas are the bright spot on the right, the Andes are the spot in the bottom left.
Week 10 (2021-05-20): Sahara Elevation Rainbow
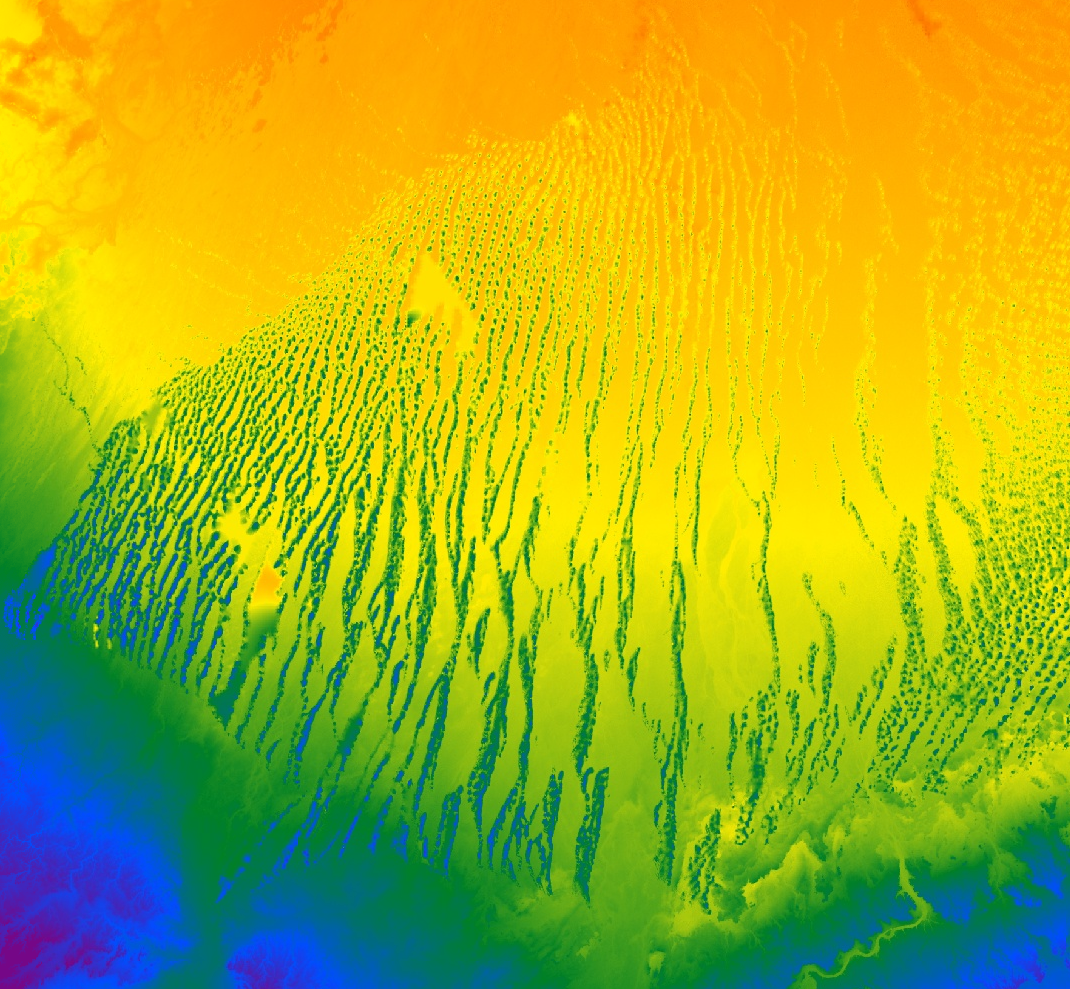
I was feeling something colorful and simple today, so here is SRTM elevation maps of the Tabelbala area of Algeria, the Amenas district of Algeria, and the Morocco-Alegeria border region stretching between Tabelbala and Errachidida.
Week 9 (2021-05-13): English Channel Ships

Learning to use the GEE Python API for the first time. Used it to make this cumulative timelapse of ships in the English Channel (detected using Sentinel-1’s SAR) over a still falsecolor composite of Sentinel-2 visual imagery.
Week 8 (2021-05-06): NDBI Timelapse
Still figuring out how to manipulate videos. This time we have annual composites of the Normalized Difference Built-Up Index using Landsat 8 for Philadelphia and for Chengxizhen, China. Can’t say I am satisfied with how they turned out, but I’m learning.
Week 7 (2021-04-29): Ocean Currents
Nothing fancy this week, just experimenting with video for the first time. I used some of the water temperature at three depths from HYCOM, looking at an area just east of Japan. Short & compressed version below. Longer,uncompressed here: https://drive.google.com/file/d/1T1LpAw7py4N3CHQ66o4eCLuy6ELcjNgK/view?usp=sharing
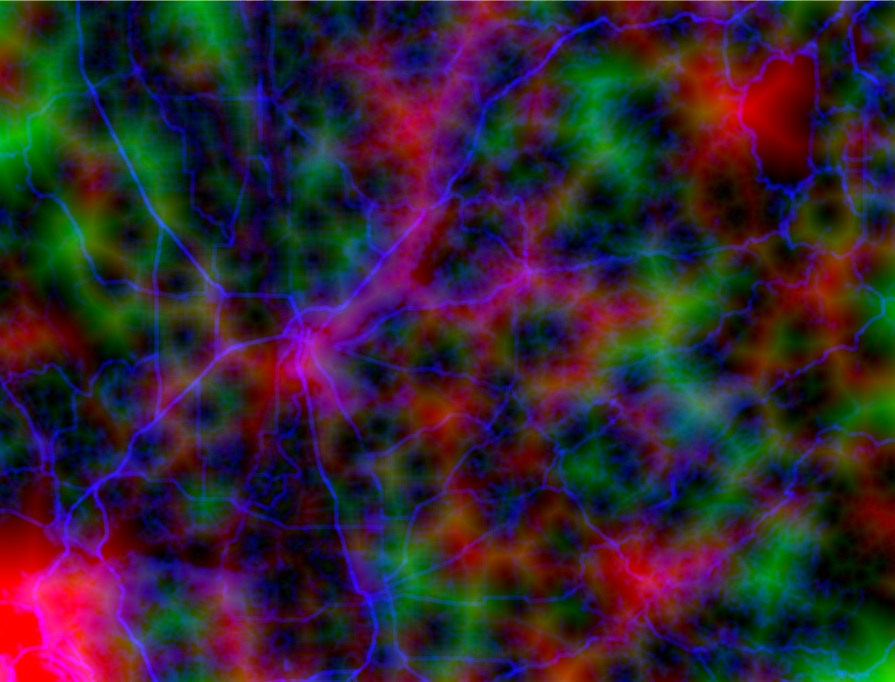
Week 6 (2021-04-22): China Nightlight Edges
Just one image this time, which was generated using some filtering and edge detection on the VIIRS nightlights monthly composites. Location is in the Hunan/Anhui region of China.
Week 5 (2021-04-15): Andes Elevation
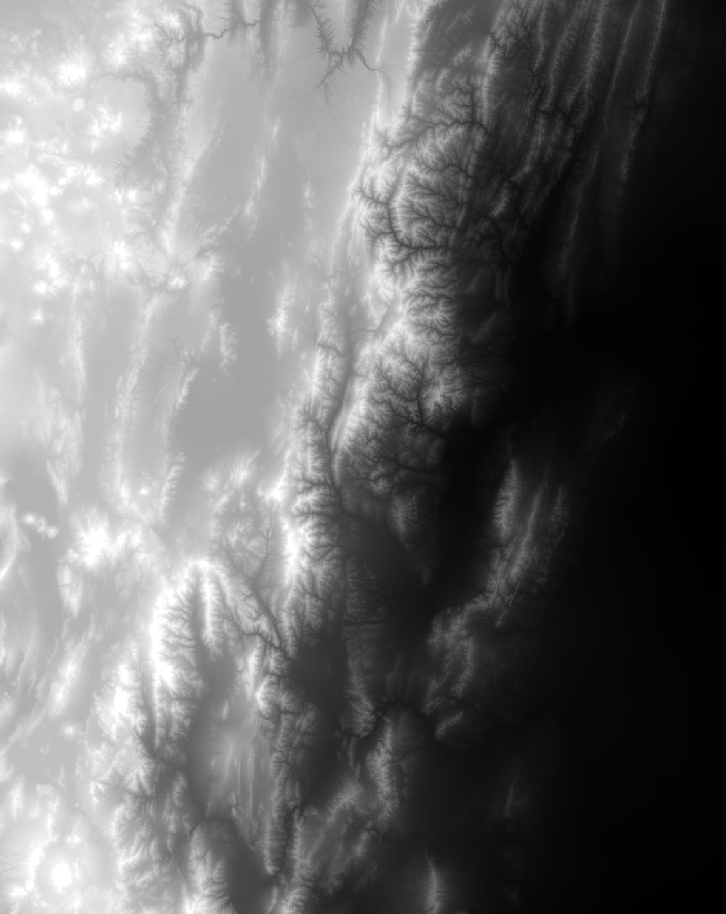
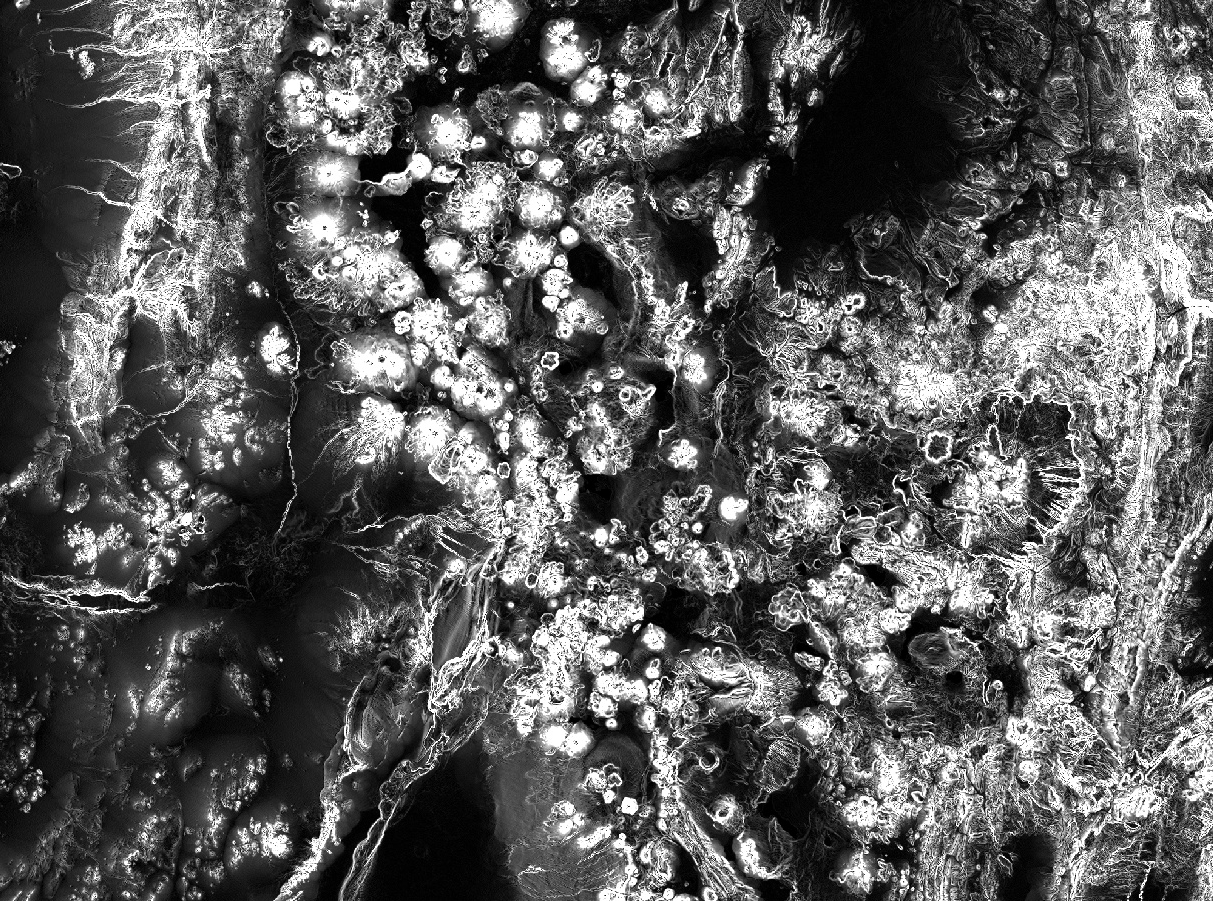
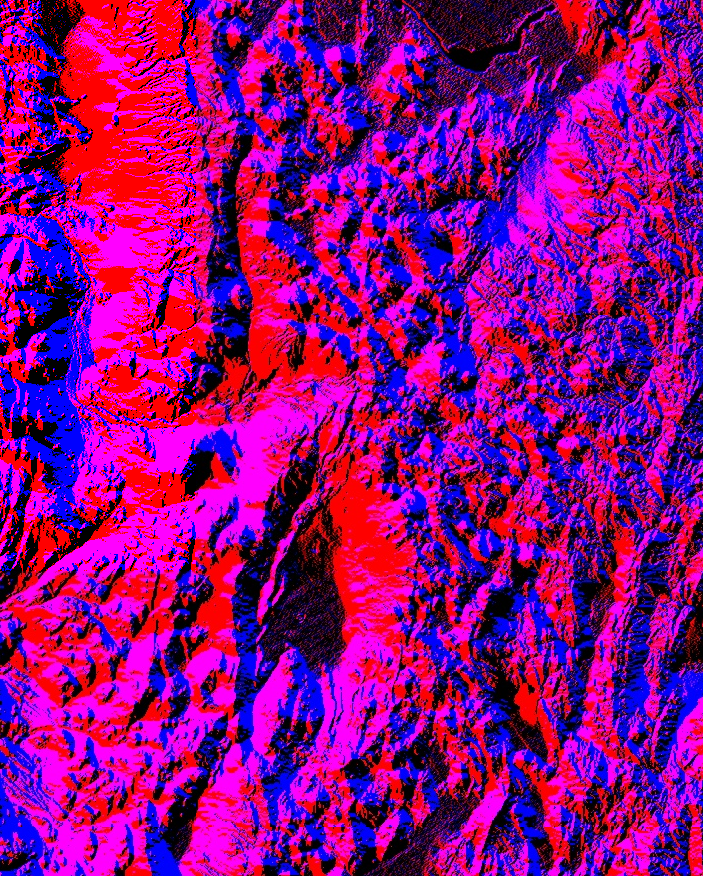
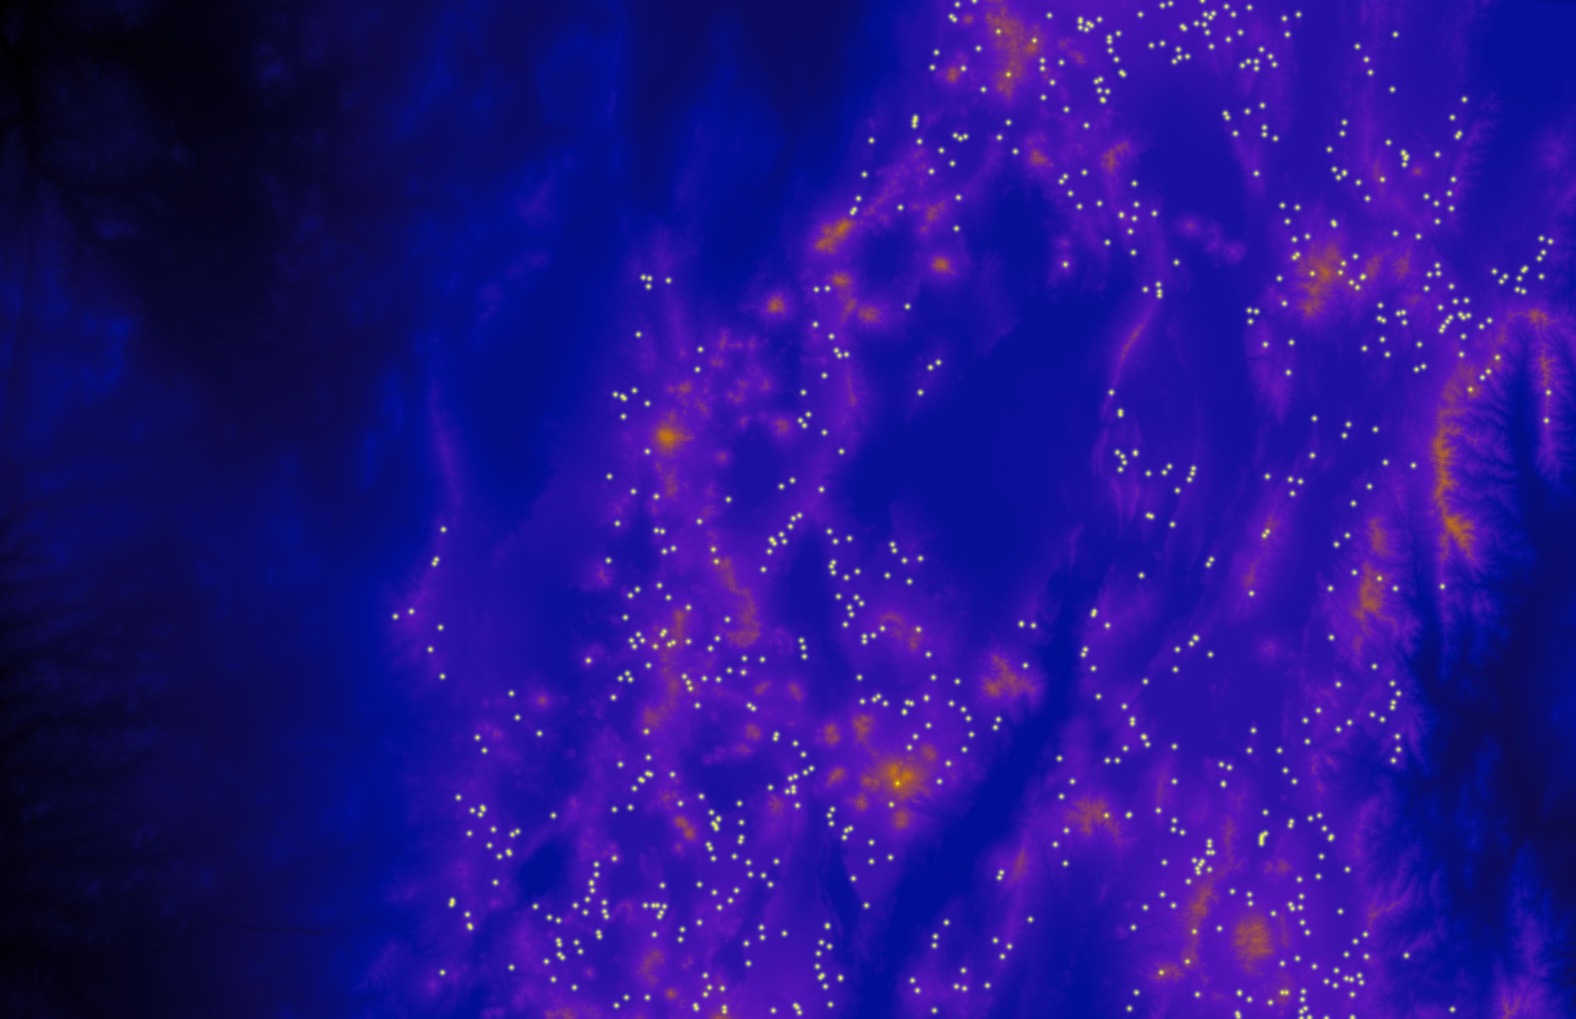
A collection based on SRTM elevation data, all of the Chilean Andes. 1) Grayscale of elevation on the eastern edge of the mountains. 2) Elevation gradient magnitude. 3) Gradient with R=dx, G=dy, B=dy. 4) Elevation with some local maxima (peaks) shown as dots.
Week 4 (2021-04-09): Edge Filtering
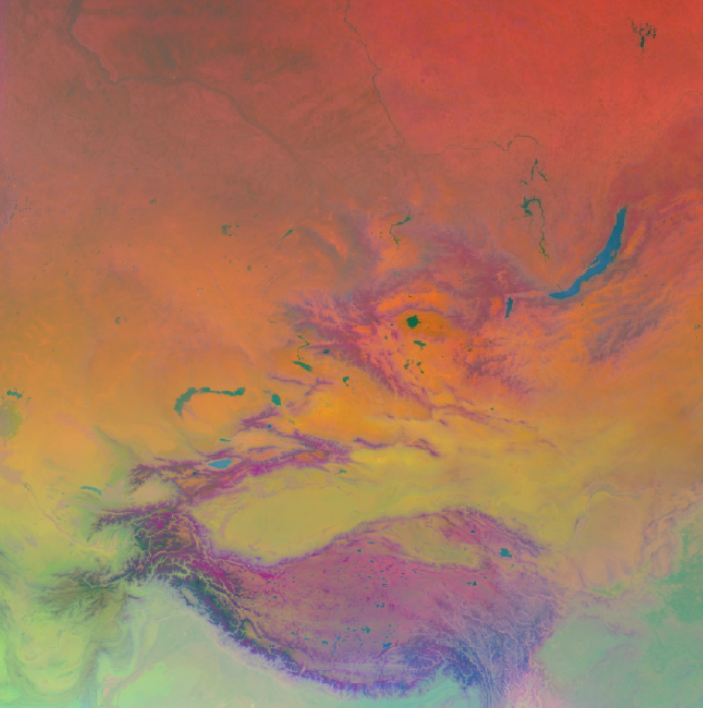
Two images of southern Tibet based on @USGSLandsat 8’s panchromatic band. The first is a visualization of gradient magnitude. The second is a combination of gradient magnitude and direction.
Week 3 (2021-04-01): Temporal Nightlights in San Antonio & Basra
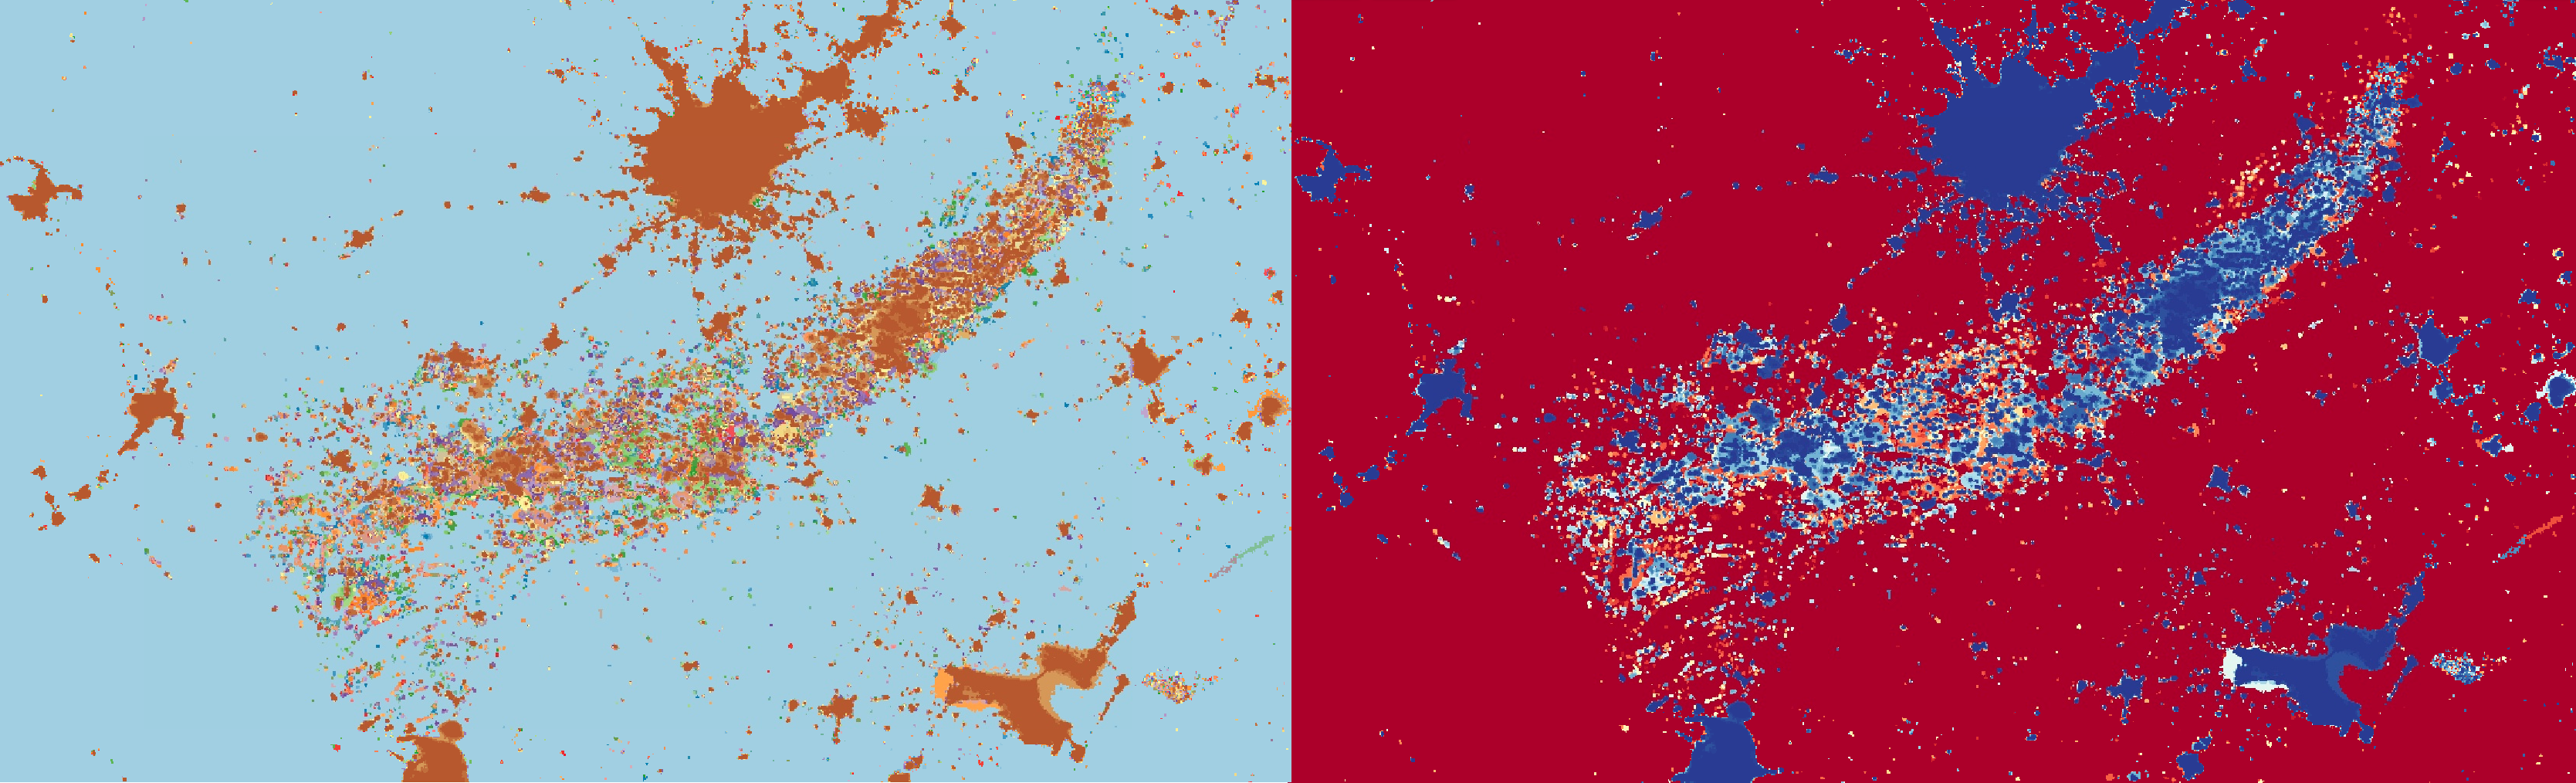
Got a pair of diptychs here based on the VIIRS DNB monthly composites. Colors indicate the first time bright lights above a threshold showed up. First is San Antonio area showing what I assume are natural gas wells. The second is centered on Basra, Iraq.
Week 2 (2021-03-25): Malaca Ships
A Sentinel-1 composite from 2014-2021, pulling out the bright objects (primarily ships) in the Strait of Malacca. I messed around with adding backgrounds to it (thermal IR, coastal blues, etc.) and filtering out the non-ship objects, but decided it is best as is
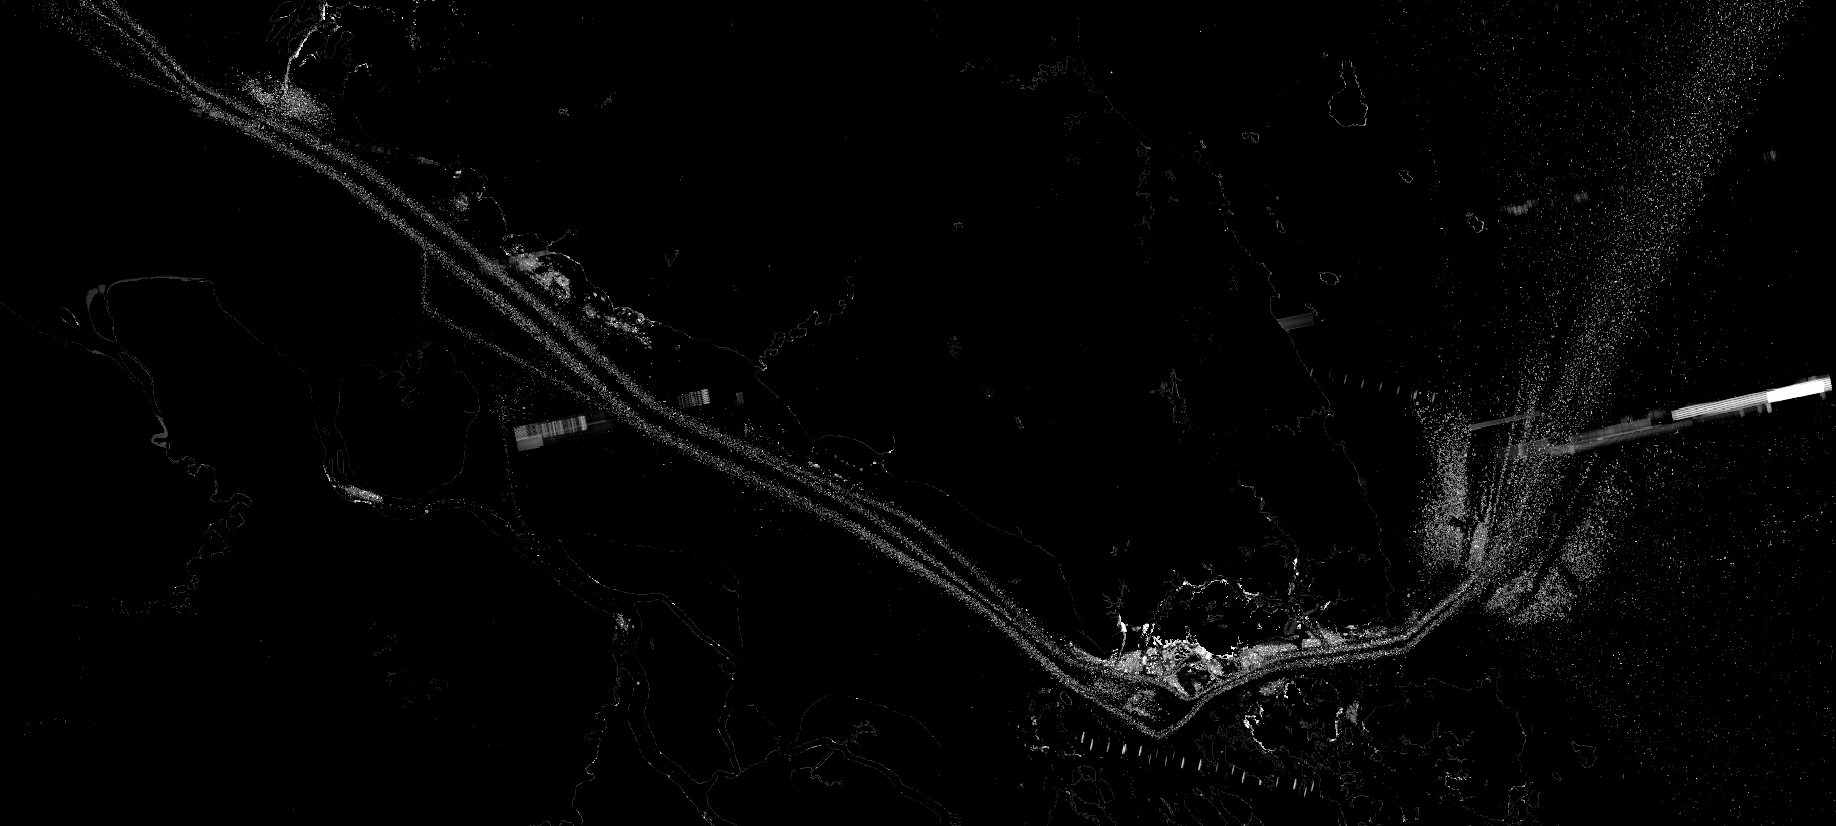
Week 1 (2021-03-18): Sundarban
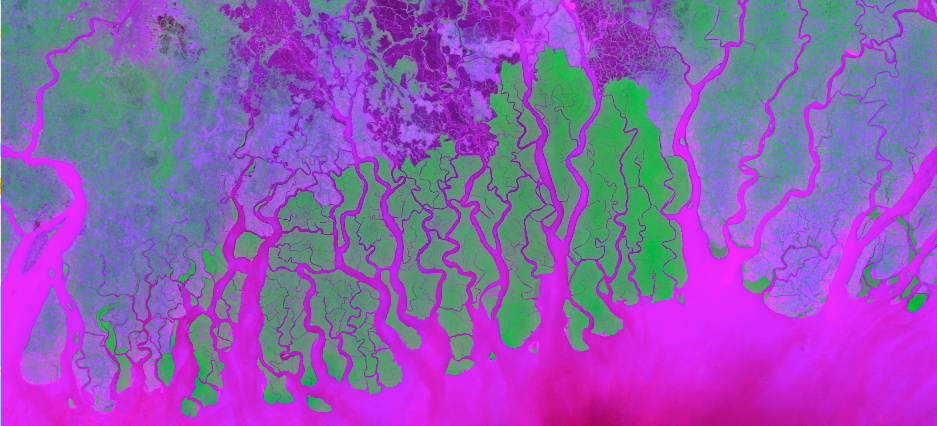
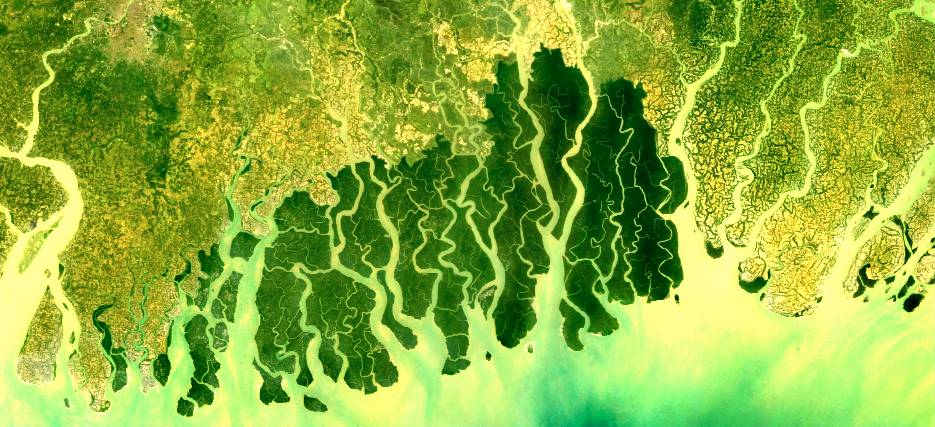
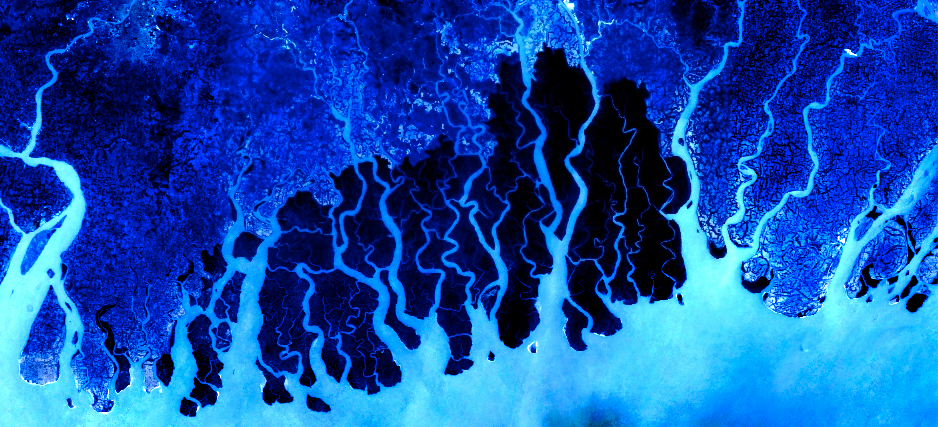
I decided to take some time each Thursday and make some pretty satellite images unrelated to research. Thought that I would start simple, so here are some Landsat 8 false color composites of the Sundarbans, on the border of India and Bangladesh.